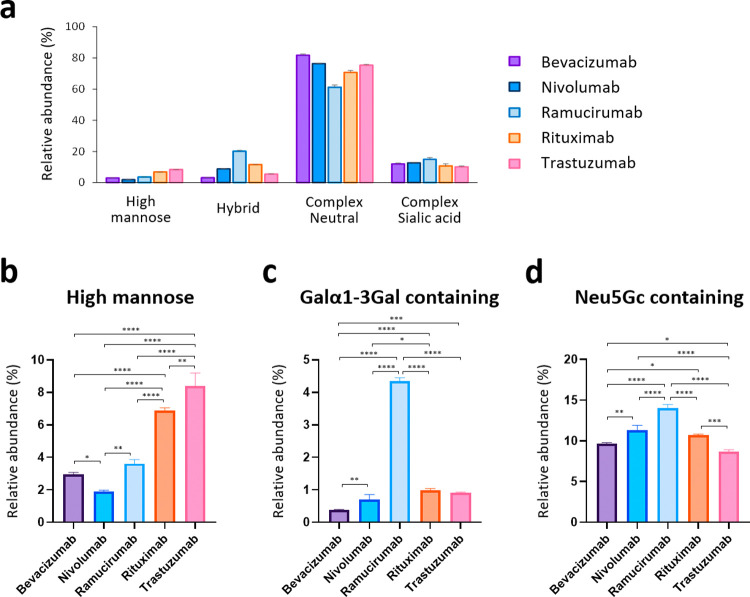
Figure 3.
Comparison of N-glycans from the five therapeutic antibodies. (a) Category comparison of N-glycomes obtained from five therapeutic antibodies. Error bars represent the standard deviation determined from three technical replicates (for statistical analysis, see Figure S10). (b–d) Relative abundances of (b) high mannose, (c) Galα1-3Gal-containing, and (d) Neu5Gc-containing glycans of the five therapeutic antibodies. Error bars represent the standard deviation (n = 3, independent technical experiments). The P values were calculated by Tukey’s multiple comparisons test. Only statistically significant differences are shown. *P < 0.05, **P < 0.01, ***P < 0.001, ****P < 0.0001.

