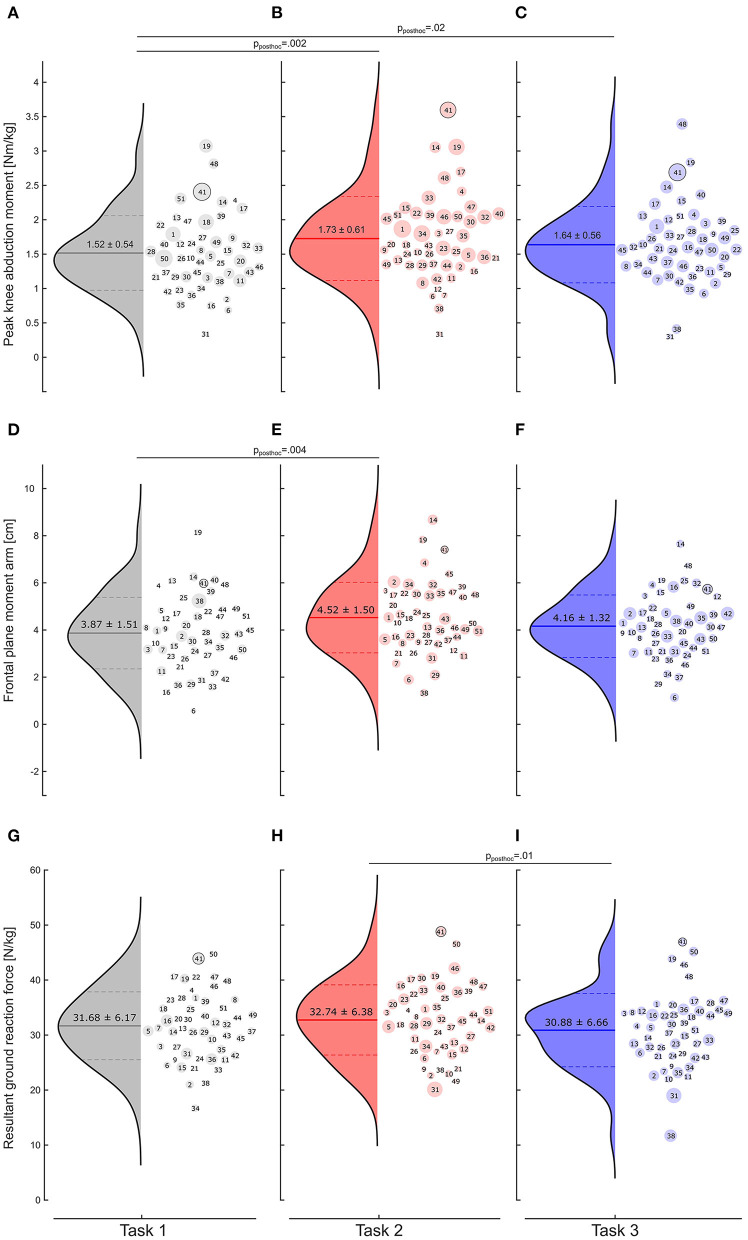
Figure 2.
Distribution of the peak knee abduction moment [Nm/kg] within the first 100 ms after initial contact for task 1 (A), task 2 (B), and task 3 (C). Bold lines within the distribution curves represent the average peak knee abduction moment, and dashed lines the standard deviations. The diameters of the dots in the scatters are scaled to the individual standard deviation. The player's number in each scatter helps track the individual rank in each task. (D–F) Distribution of the frontal plane moment arms of the knee joint for the three task complexities; (G–I) Resultant ground reaction forces and peak knee abduction moments for the three task complexities.

