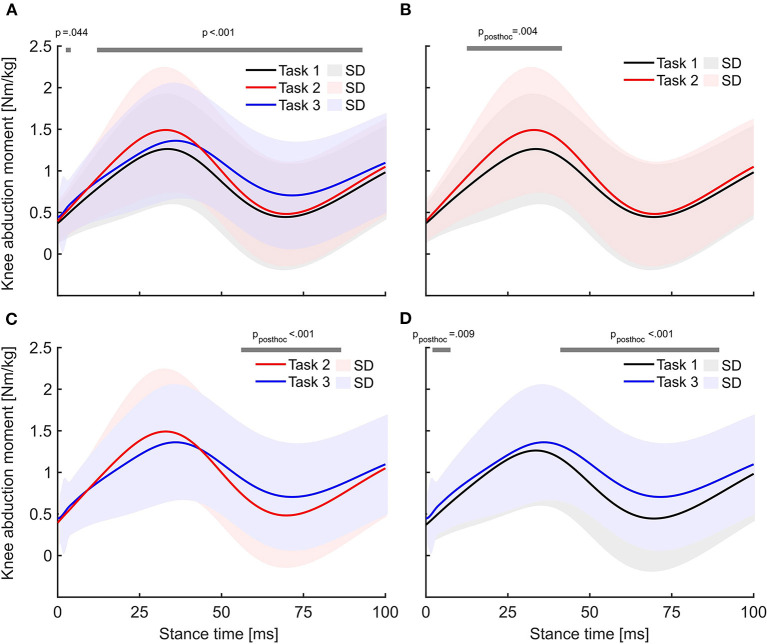
Figure 3.
Average external knee abduction moment curves within the first 100 ms of stance. (A) Statistical parametric mapping results using repeated-measures ANOVA. The gray lines above the graph indicate significant differences over the respective time interval. (B–D) Pairwise comparison of the knee abduction moment curves for each possible task combination, gray lines highlighting significant differences over time using Bonferroni-corrected alpha levels.

