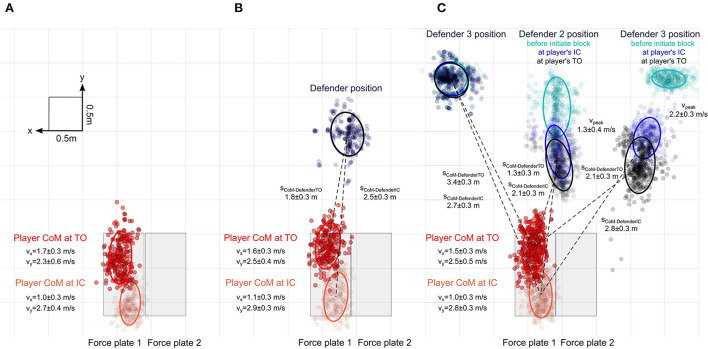
Figure 4.
Bird's eye view of the dynamic testing situations. (A) Kinematics of the center of mass (CoM) and the point of force application (PoFA) for each cut at initial contact (IC) and toe-off (TO) for task 1. (B) Kinematics of the CoM for each cut at IC and at TO, and the position of the static defender for Task 2. (C) Kinematics of the CoM for each cut at IC and TO for task 3. Turquoise dots visualize the position of each defender before initiating the block, blue dots represent the defenders' position at the instance of the athletes' IC, and black dots represent the defenders' positions at the athletes' TO. Dashed lines represent the average distance to the respective regions. Ellipses around regions visualize standard deviations.

