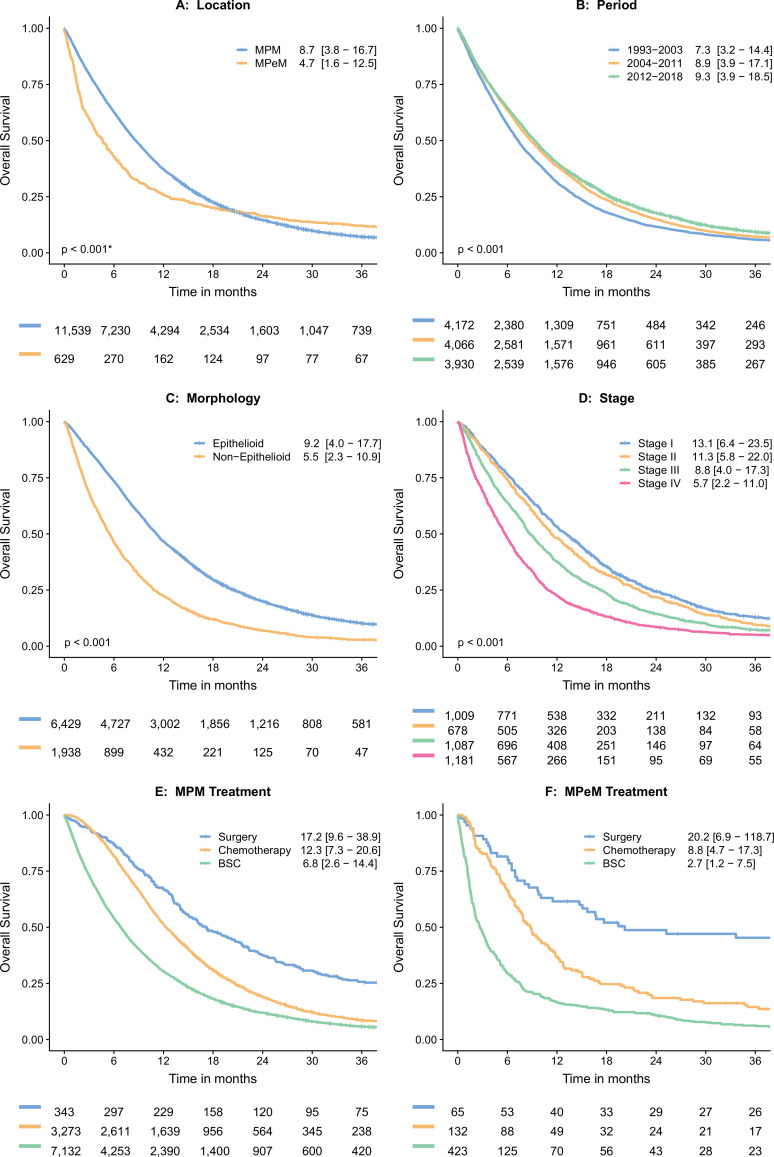
Figure 4.
Kaplan-Meier actuarial overall survival curves with median overall survival (IQR) in months and numbers at risk. *Breslow (generalised Wilcoxon) p value, calculated for non-proportional hazards. (A) Overall survival (OS) compared per location (MPM vs. MPeM), (B) OS compared per time period. (C) OS compared per morphological subtype. (D) OS compared per stage for pleural mesothelioma (MPM), only data from 2008 to 2018 were used as the seventh edition of the TNM staging manual was published in 2007. (E) Showing OS for different treatment modalities in MPM. (F) Showing OS for different treatment modalities in MPeM. BSC, best supportive care; MPeM, malignant peritoneal mesothelioma; MPM, malignant pleural mesothelioma; TNM, tumour, node, metastases.

