Abstract
New electrode materials for supercapacitor devices are the primary focus of current research into energy-storage devices. Besides, exact control of the proportions of these new materials while forming electrodes for coin cell supercapacitor devices is very important for the large-scale manufacturing or at industrial scale. Here we report a facile synthesis of CrOOH with ascorbic acid and explore an exact composition with reduced graphene oxide to achieve a highly efficient electrode material for supercapacitor devices. The rGO is synthesized by modified Hummer’s method followed by reduction with ascorbic acid, whereas ultrasmall CrOOH nanoparticles result via hydrothermal treatment of the reactants Cr(NO3)3, NaOH, and ascorbic acid at 120 °C for 12 h. The ultrasmall CrOOH nanoparticles show an amorphous phase with particle size range 3–10 nm and a calculated band gap of 3.28 eV. Six different composites are prepared by varying the proportion of CrOOH and rGO materials and further utilized as active electrode materials for fabrication of the coin cell supercapacitor devices. We report the highest specific capacitance for the 70% CrOOH and 30% rGO composite that exhibits a capacitance of 199.8 mF cm–2 with a long cyclic stability up to the tested 10,000 charge/discharge cycles. The proposed supercapacitor device exhibits a high energy and power density of 8.26 Wh kg–1 and 3756.9 W kg–1, respectively, at Ragone Plot, showing the commercial viability of the device.
1. Introduction
The continuously increasing concerns on the world’s energy consumption and environmental pollution have led to immensely increased research into the area of sustainable energy sources.1 Renewable energy resources such as solar, hydro, and wind energy are the most promising solutions for addressing these concerns. However, due to the large fluctuations in the generation, electricity produced from these renewable energy sources must be efficiently stored to supply the world with energy on demand. Currently, lithium-ion batteries with a high energy density of 100–250 Wh kg–1 are the widely utilized commercially available products for these applications, but they still suffer from low power density, limited cycle life, safety issues, high cost, limited availability of lithium resources, and lack of ecofriendliness.2−5 These critical issues have inclined the researchers to investigate about new and exotic materials or composites as electrode materials for efficient device fabrication to meet the current needs, driven by human development as well as environmentally benign concerns too.6
Keeping in view the high rate capability, pulse power supply, long cycle life, simple principles, high dynamics of charge propagation, and low maintenance cost, the supercapacitor is a suitable candidate for the new and efficient energy-storage device.7 A simple array, as in the case of batteries, formed by two current collectors, two electrodes, and a separator between the electrodes and the electrolyte are the main components of a supercapacitor cell.8 Supercapacitors are energy-storage devices, the main element of which is the electrode, which may consist of carbon-based materials or derivatives, metal oxides, and conducting polymers.9 The principle of operation of these devices is based on the high-speed electrostatic or Faradaic charge storage electrochemical process. The charge is mainly stored at the electrode–electrolyte interface of the active materials. By using one active electrode material with 1000 times higher surface area, the specific capacitance and energy density are increased by a factor of 100,000 or even greater than that of regular capacitors. Furthermore, by pseudo-capacitance (fast Faradaic reactions), the supercapacitors can even store energy up to several thousand Farads per device, which is much higher than the micro- or milli-Farads stored by conventional capacitors.3
Metal oxides have attracted the attention of the scientific community as ideal candidates for manufacturing supercapacitors, because of their abundance, low cost, and several oxidation/reduction reactions that they can go through during the storage process.10 Among the various metal oxides used so far, Cr2O3 has been widely studied and has shown very good performance to be used as an active material.11−14 However, in most reports, the process of synthesis of Cr2O3 demands CrOOH as a precursor.15,16 Here we report the generation of ultrasmall nanoparticles of chromium oxide (CrOOH) by a simple, fast, and facile hydrothermal approach utilizing ascorbic acid (first time utilized for CrOOH synthesis) as a reducing agent for the reduction of chromium nitrate (Cr(NO3)3 × 9H2O), which is more economical, energy, and significantly time saving in comparison to the earlier reports of Cr2O3 particles. The reduced graphene oxide (rGO) was synthesized using modified Hummer’s method followed by reduction with ascorbic acid (C6H8O6); further, various composites of rGO and CrOOH were formed in different proportions and utilized as electrode materials for supercapacitor devices.
2. Experimental Section
2.1. Synthesis of Ultrasmall CrOOH Nanoparticles
In a typical experimental procedure, 0.1 M of Cr(NO3)3 × 9H2O was dissolved in 100 mL of deionized water and then 2 M of sodium hydroxide (NaOH) was added with constant stirring for 20 min. Further, 6 g of C6H8O6 was added to the solution under stirring for 30 min and the resultant solution was then transferred into a Teflon-lined stainless-steel autoclave (200 mL capacity) for hydrothermal treatment at 120 °C for 12 h. Once the reaction time was completed, the system was automatically cooled down to room temperature. The as-obtained product was washed several times with deionized water to remove water-soluble organic/inorganic byproducts. The as-obtained sample was freeze dried in a freeze dryer, which resulted in the form of a powder sample and was utilized for further characterizations.
2.2. Synthesis of rGO
Graphene oxide (GO) was synthesized from graphite powder using modified Hummer’s method.17 In brief, 1 g of graphite and 100 ml of sulfuric acid were mixed, followed by the addition of 6 gm of potassium permanganate (KMnO4) under constant stirring. During the mixing of KMnO4, the beaker temperature was maintained at ∼5 °C in an ice bath to avoid any kind of explosion due to the rise in temperature of the mixture because of exothermic reaction, and further, the mixture was stirred at room temperature for 2 h. The resulting solution was sonicated for 1 h and then left for stirring for 48 h. This solution was diluted by adding 400 mL of water under vigorous stirring for 1 h to obtain GO. Hundred milliliters of the as-obtained GO solution was taken, and thereafter, 10 g of C6H8O6 was added under constant stirring for 20 min. The resulting solution was washed several times with deionized water and dried in a freeze dryer.
2.3. Structural/Microstructural Characterizations
The crystallographic information of the freeze-dried powder samples of CrOOH was gathered by powder X-ray diffraction (XRD) using a XRD-Shimadzu 6000 powder diffractometer (Cu-Kα radiation, 40 kV, and 30 mA). The microstructural characterizations were done using a scanning electron microscope (SEM Zeiss at 30 kV) and a transmission electron microscope (TEM) using a Hitachi Model HT7700 at 120 kV. The optical spectra were recorded using Perkin Elmer′s Lambda 750 ultraviolet/visible/near-infrared (UV/vis/NIR) spectrophotometer.
2.4. Coin Cell Supercapacitor Device Fabrication Using the CrOOH/rGO Composite
The two-electrodes configuration was utilized for coin cell device fabrication. The electrodes were made of poly(methyl methacrylate) (PMMA) binder, solvent acetone, and commercial-grade activated carbon (AC) mixed with active material. The activated carbon and binder, constituting 40% of the electrode material, remained constant in each set of electrode material. The other 60% of active materials were formed from CrOOH and rGO, which were mixed in six different proportions, as shown in Table 1. The final mixture was made in two steps. As a first step, CrOOH and rGO were mixed in the desired proportion in 5 mL of acetone and sonicated for 40 min to form the CrOOH/rGO slurry. In the second step, PMMA and activated carbon were mixed with the as-obtained slurry and further sonicated for 20 min until a viscous mixture was obtained. This slurry was deposited on stainless-steel thin disks by using the spin coating technique and the solvent was evaporated. The electrodes were separated by a filter film soaked in liquid electrolyte, sandwiched with stainless-steel cell with a pressure of 1.33 MPa, and formed the final coin cell supercapacitors.
Table 1. Active Electrode Materials Prepared with Different Proportions of the CrOOH and rGO Composite for Coin Cell Supercapacitor Device Fabrication.
| proportion |
|||||
|---|---|---|---|---|---|
| 60% active material | 40% binder and AC | ||||
| samples | mass loading (mg cm–2) | CrOOH (%) | rGO (%) | AC (%) | PMMA (%) |
| S0 | 1.82 | 0 | 100 | 75 | 25 |
| S30 | 0.80 | 30 | 70 | 75 | 25 |
| S50 | 1.09 | 50 | 50 | 75 | 25 |
| S70 | 1.42 | 70 | 30 | 75 | 25 |
| S80 | 0.96 | 80 | 20 | 75 | 25 |
| S100 | 1.62 | 100 | 0 | 75 | 25 |
2.5. Electrochemical Characterization of Coin Cell Supercapacitor Device
The electrochemical properties and capacitance measurements of the supercapacitor electrodes and devices were studied in a two-electrode configuration by cyclic voltammetry (CV), electrochemical impedance spectroscopy (EIS), and galvanic charge/discharge (GCD) through an Interface 5000E Gamry instrument.
3. Results and Discussion
Figure 1 shows a schematic presentation of the experimental details as described in the Experimental Section. The as-synthesized light green color product was characterized by various techniques for the structural determination, phase identification, and morphological and microstructural characterization.
Figure 1.
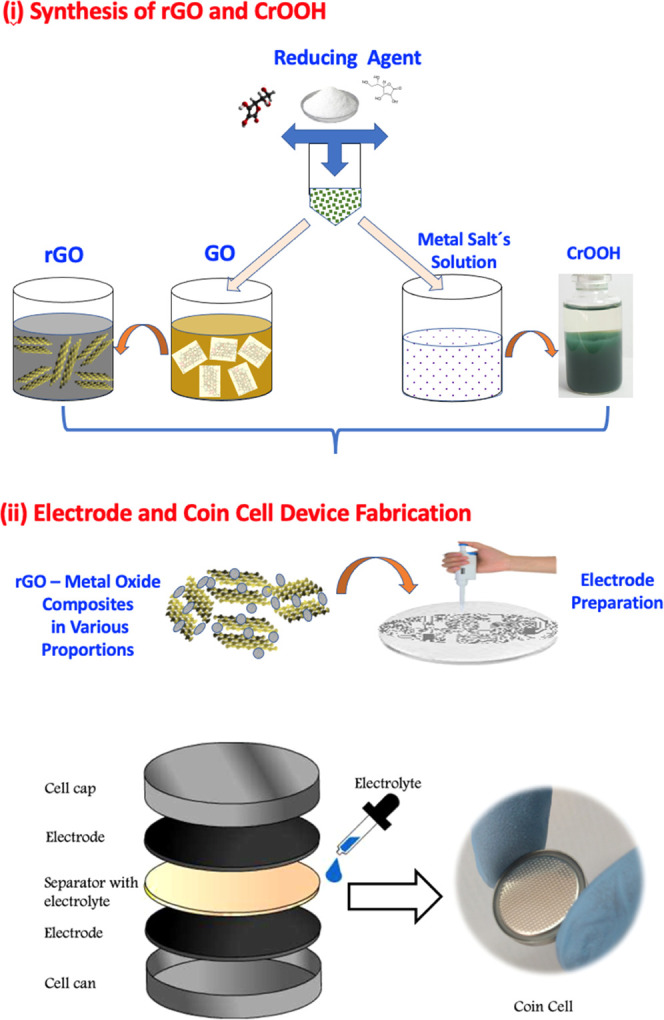
Schematic representation of the experimental details: (i) synthesis of rGO and CrOOH and (ii) electrodes and coin cell device fabrication.
3.1. Structural, Morphological, and Optical Characterization of the CrOOH Sample
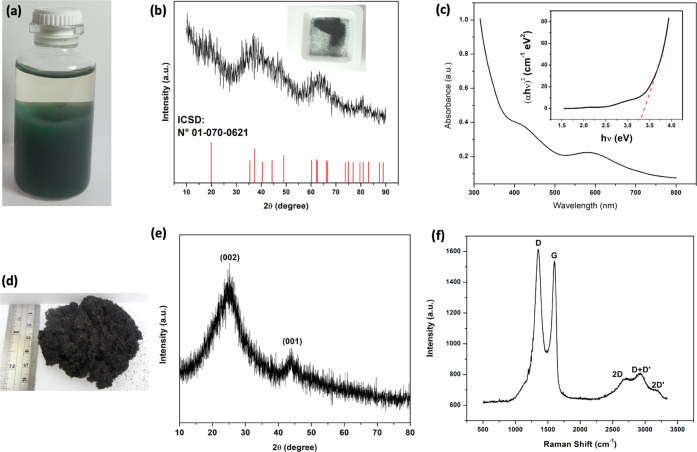
Figure 2a shows the optical image of the as-synthesized light green color material. In general, the suspended particles seem very light and take a long time to settle down. The X-ray spectra of the as-synthesized and freeze-dried sample are shown in Figure 2b. The spectra show peaks of CrOOH with very low intensity, which can be due to the very small size and poor crystallinity of the synthesized nanoparticles. All of the peaks match well with the amorphous phase of CrOOH (ICSD No. 01-070-0621).16,18 The asymmetry in the three main peaks also indicates the overlapping and superimposition of various other peaks located in the vicinity of the more intense peaks. The peak broadening is also due to the formation of ultrasmall particles and overlapping of CrOOH peaks with various characteristics.15,19 This overlapping effect can be divided into the superposition of the peaks corresponding to 2θ = 35.4, 37.3, 40.4, 44.3, and 49 to form the first intense peak that we observe between 30 and 50; the superposition of peaks corresponding to 60.2, 62.2, 62.4, and 66 for the second intense peak in between 60 and 70 and the third intense peak located around 80° results from the superposition of the peaks that correspond to the positions 79.5 and 80.9° of the diffractogram also reported by others works.20 Thus, the diffractogram shape obtained is due to the amorphous character of the nanoparticles as well as their ultrasmall size.
Figure 2.
(a) Optical image of the as-synthesized green color nanoparticles before freeze drying. (b) XRD of the freeze-dried ultrasmall CrOOH nanoparticles; the inset is an optical image of the freeze-dried sample. (c) UV–visible absorption spectra of the CrOOH powder as obtained after the freeze drying process; the inset is a band-gap calculation from the obtained spectra. (d) Optical image of the freeze-dried rGO sample. (e) XRD pattern and (f) Raman spectra of rGO.
Electrical conduction is a fundamental characteristic for choosing materials to manufacture supercapacitors. Because of the poor crystallinity of CrOOH, we studied the band gap of the material to know its electrical conduction. UV–visible absorption is a process in which transition to high-energy levels occurs, producing absorption-radiant energy. In this process, the spectrum obtained due to optical absorption can be analyzed to get the energy band gap of the material. This energy band gap is calculated using the Tauc plot relation21
where A is a constant, α is the absorption coefficient, and n is a constant for a given transition, which is equal to 1/2 for direct band gap, h is Planck’s constant, and v is the frequency. The band gap is determined by the extrapolation of the straight portion of the plotted graph to the energy axis at α = 0. The energy gap is estimated by using the τ ratio. Figure 2c shows the recorded absorbance spectrum of ultrasmall CrOOH nanoparticles in the range of 300 to 800 nm. The graph inset shows the band-gap calculation from the Tauc relation as described above. The extrapolated line cuts the band-gap axis at an energy gap value of Eg = 3.28 eV, which can be assigned to the band-gap transition of Cr3+ ions.22
Figure 2d shows an optical image of the as-obtained and freeze-dried rGO sample after reduction with ascorbic acid. Figure 2e is a typical XRD pattern of the rGO sample, and all of the peaks are in accordance with JCPDS-Card No. 41-1487. The broad and the most intense peak at position ∼25.9° represents the 002 plane of graphite, which is a characteristic peak of rGO. The second intense peak (∼43.8°) corresponds to the (100) plane of graphite.23
Figure 2f shows the Raman spectra of the as-obtained rGO sample, which show the two highest peaks corresponding to D and G bands located at 1348 and 1596 cm–1, respectively. These peaks are the main characteristic lines in the Raman spectrum of rGO. The peak G is characteristic of graphene and the peak D corresponds to the allowed high-frequency phonon E2g, which gives information on the structural defects induced to the basal plane of graphene during the oxidation of graphite. For the chemically synthesized graphene, the relative intensity of the D and G bands or the intensity ratio ID/IG provides a measure of the degree of disorder in the crystallite sizes and aromatic structure of the graphitic materials, which indicates the capacity of the reducing agent utilized for the reduction of oxygen-containing functional groups.24 The high intensity of the D band represents the formation of a large number of defects and disorders at the graphene surface due to the efficient reduction by ascorbic acid. The intensities of the G and D bands are 1537.7 and 1616.4 a.u., resulting in an intensity ratio of ID/IG = 1.1. This indicates that the synthesized rGO has a high defect density, which could be associated with a chemical interaction, surface dislocation, corrugation, or vacancies. Additionally, the presence of the two-dimensional (2D) peak at 2697.2 cm–1 and the D + D′ peak at 2930.4 cm–1 indicates the improved graphitization and the presence of few layered graphene sheets, whereas the 2D′ peak at 3184.6 cm–1 is the D′ overtone. Since 2D and 2D′ originate from a process where the momentum conservation is satisfied by two phonons with opposite wavevectors, no defects are required for their activation and are thus always present.23,25,26
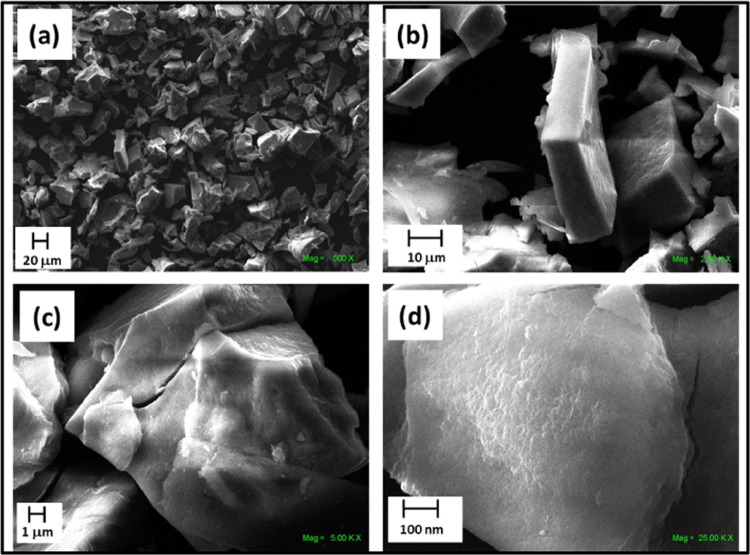
SEM was used for the morphological and surface analysis of the synthesized materials. The morphology of the surface is shown in Figure 3. The low- and high-magnification images are shown in Figure 3a–d. The low-magnification image shows large numbers of agglomerated block structures of different sizes and thicknesses. Figure 3b represents the lateral view of such a block structure formed by CrOOH particles. The length and width of this block are ∼30 μm each, and the thickness is ∼10 μm. Figure 3c shows a higher-magnified SEM image of an individual block, showing that these large, agglomerated blocks are of nonuniform shapes and rough surfaces. In Figure 3d a large number of agglomerated small-sized particles can be observed at the surface of the block, which indicates that these blocks are made up of agglomerated CrOOH nanoparticles.
Figure 3.
Low (a, b) and high (c, d) magnification SEM images of the CrOOH sample.
The agglomeration observed in the SEM micrographs may be due to the freeze-drying process of the as-synthesized suspended materials (as shown in Figure 2a) to obtain the dried samples. Firstly, the sample was frozen in a freezer at −20 °C (without using any dispersant or surfactant) and secondly, it was dried in a freeze dryer by the vacuum process. All of these processes resulted in the agglomerated nanoparticles taking the form of big blocks.11
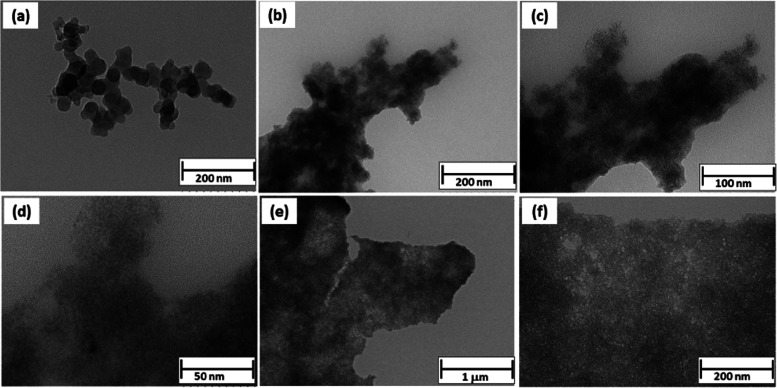
To verify the size of the as-obtained hydrogel-like suspended materials, few drops of the sample were coated on a formvar and carbon-coated TEM grid and dried for further TEM analysis. The panels of Figure 4 represent the low- and high-magnification TEM images of the as-obtained sample. In Figure 4a, small nanoparticle-like structures can be seen. Figure 4b also shows clusters of agglomerated nanoparticle-like structures. The higher-magnified images show (Figure 4c,d) the formation of ultrasmall nanoparticles having sizes in the range of 2–4 nm. The nanoparticles are of undefined shape and size, which indicates the amorphous nature of the particles, also confirmed by XRD, as shown in Figure 2b. To observe the homogeneity of the structure, the materials were also explored in different regions. Figure 4e,d shows the TEM images of the sample in different regions. From the X-ray analysis and TEM images, it can be concluded that the nanoparticles are not only ultrasmall but also of amorphous nature.
Figure 4.
(a–f) TEM images of the as-synthesized CrOOH material.
A plausible formation and growth mechanism can be given by the following equation.
Ascorbic acid acted as a surfactant and slowed down the reaction kinetics, which did not allow the formation of bigger-sized particles and agglomeration. It also plays an important role in the controlled growth of nanoparticles such as CuO.27−29
3.2. Electrochemical Performances of Coin Cell Supercapacitor Devices
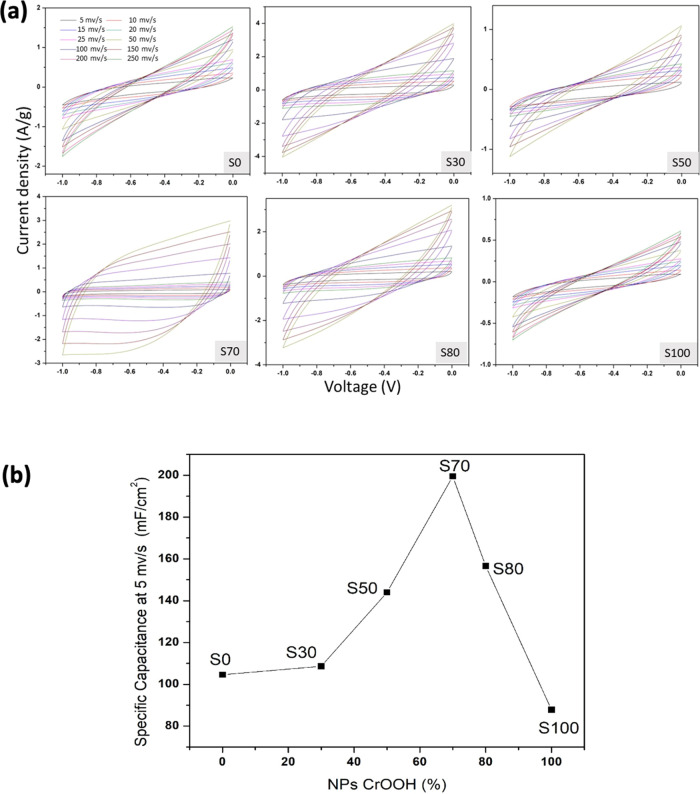
The capacitive performances of the coin cell supercapacitor devices, which were made of CrOOH/rGO composites in six proportions (as described in Table 1), were evaluated by CV, GCD, and EIS by utilizing the two-electrode configuration according to the best-known practice for these types of tests.30,31 The CV was taken at ambient temperature by using a 6 M KOH aqueous solution as the electrolyte. Figure 5a shows the CVs of the six CrOOH/rGO-based devices with various compositions in a potential window of −1 to 0 V at different scan rates of 5, 10, 15, 25, 50, 100, 150, and 200 mV s–1, respectively. No redox peaks are observed in the CV curve of the devices and they show a typical supercapacitor shape,32 indicating that charge separation is dominated by double-layer capacitor behavior, i.e., by physical adsorption of charges. The curves show a small degree of nonlinearity in comparison with the ideal supercapacitor behavior, which may be due to the adsorption of the electrolyte species with surface oxygen.33 From the CV curves obtained in Figure 5a, the specific capacitance (Cs) was calculated for each device by using the following equation
where I, V, Φ, and v are the response current density (A), potential (V), surface area of the electrodes (cm2), and potential scan rate (mV s–1), respectively.31 To estimate which of the devices shows a better specific capacitance value, the Cs values of all of the curves were calculated at 5 mV s–1 and plotted as a function of the percentage of nanoparticle concentration used for the effective electrode material (% NPs-CrOOH), as shown in Figure 5b. Each point in the curve shows the as-obtained specific capacitance by CV analysis of the corresponding devices at different compositions. Each point in the curve represents the device fabricated by the corresponding sample’s name and details as mentioned in the table. For example, the point S0 refers to the specific capacitance of the device fabricated without CrOOH and 100% rGO, which has a Cs value of ∼104 mF cm–2. The obtained Cs values of all of the devices are very high in comparison to other reports of supercapacitor devices made of rGO where the values are ∼17 mF cm–2 or ∼700 μF cm–2.34
Figure 5.
(a) CV curves of the samples. S0 is 100% rGO; in the other samples, the number represents the proportion of CrOOH (e.g., S70 is 70% CrOOH and 30% rGO). (b) Graph of the estimated highest specific capacitance obtained at 5 mV s–1 for all of the devices.
Similarly, the other points corresponding to S30, S50, and S70 indicate the increase in the proportion of NPs of CrOOH as 30, 50, and 70%, respectively. From the graph, it can be clearly observed that as the concentration of nanoparticle is increased in the electrode material, the capacitance also increases, approaching a maximum value of 199.8 mF cm–2 for 70% of CrOOH concentration. For higher concentrations (more than 70%), the capacitance decreases, as shown in Figure 5b for the S80 and S100 devices, where the electrode of the S100 device is made up of CrOOH nPS active material only. This indicates that the optimized maximum concentration of nanoparticles is 70%.
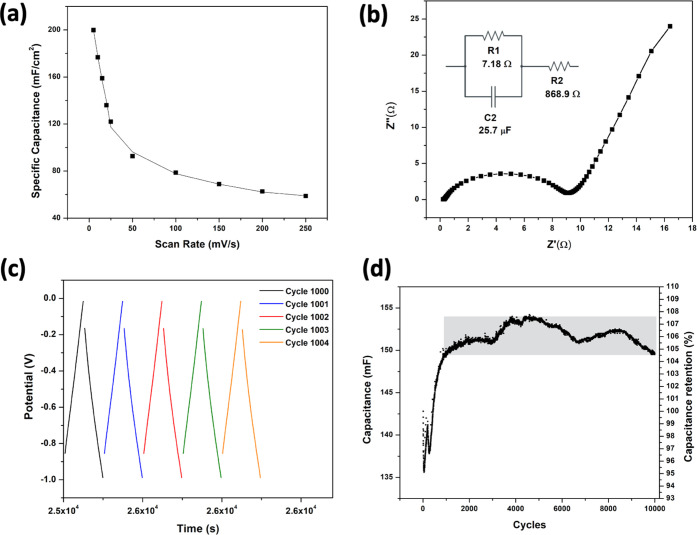
Based on the excellent performance shown by the S70 device, it was further explored for various other performance measurements (Figure 6). Figure 6a represents the specific capacitance values of the corresponding device, which indicates the highest calculated value of specific capacitance as ∼199.8 mF cm–2 at the lowest scan rate of 5 mV s–1, and the lowest value of specific capacitance as ∼58.9 mF cm–2 for the highest scan rate of 250 mV s–1. The gradual decrease of the specific capacitance while increasing the scan rate can be considered due to the limit of penetration of the electrolytic ions in the electrode materials.
Figure 6.
Electrochemical performances shown by the S70 device. (a) Specific capacitance of the S70 coin cell device at different scan rates. (b) Nyquist plot and equivalent circuit of the S70 sample; the inset shows the equivalent circuit of the proposed device. (c) Charge–discharge curve. (d) Capacity retention of the supercapacitor; the shaded region represents very low fluctuation in the capacity retention (around 3%).
The electrochemical performance of the S70 device was also studied by carrying out EIS within the frequency range of 0.1 Hz to 1 MHz. The Nyquist plot for device S70 is shown in Figure 6b, which suggests that the device behaves as a resistor at high frequencies, while it acts as a pure capacitor at lower frequencies. In the range where the Nyquist plot of the device shows its behavior like a pure condenser, the curve is fitted according to the Levenberg–Merquardt method or damped least-square (DLS). The calculated internal resistance (R1) and charge transfer resistance (R2) are 7.18 Ω and 868.9 mΩ, respectively, indicating low and optimum values of these parameters for a supercapacitor device.
Figure 6c,d shows the long-term cycling behavior of the S70 device tested by continuous charge–discharge measurements at the current density of 1 Ag–1 for 10,000 cycles. Figure 6c shows the potential curve as a function of the real-time charging and discharging for 1000–1004 cycles and Figure 6d shows the capacity retention of the device up to 10,000 charge–discharge cycles. The specific discharge capacitance of the device in the first 260 cycles shows an initial random fluctuation in the first few cycles and thereafter, a considerable increment in the capacitance from 135 to 142 mF. Furthermore, the rise in capacitance was nearly saturated, reaching the value of 149 mF in the 1000th cycle. From 1000 to 10,000 cycles, the capacitance ranges from 149 to 153 mF, as shown in the shaded region of Figure 6d. This represents a percentage change in the shaded area of 3%, and in general, the percentage change in the 10,000 cycles; taking the first cycle as 100%, the change is 12% from the lowest point of capacitance to the highest. The increase in capacitance in the first few cycles of charge and discharge can be attributed to a process of activation,35−37 already observed in electrodes made up of Cr2O3 nanoparticles.11 The curve indicates the very high-capacity retention and cyclic stability of the device in the long-term charge and discharge process.
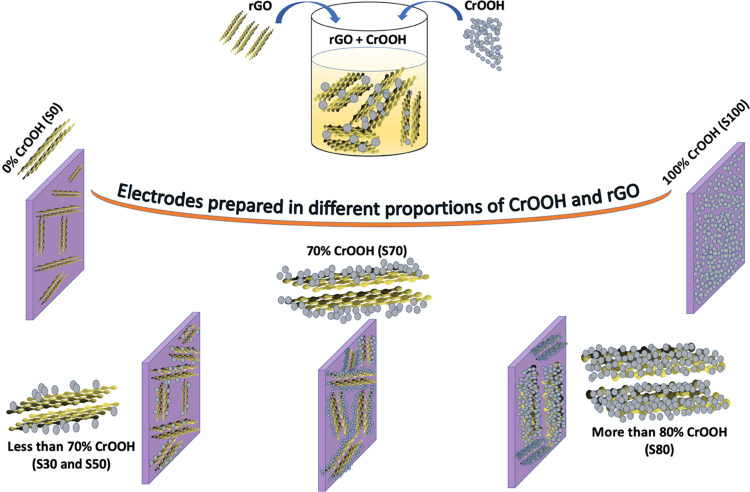
To understand the highest performance of the S70 sample (i.e., 70% CrOOH and 30% rGO), a plausible mechanism is given in Figure 7, which is a schematic representation of the electrodes prepared with various concentrations of CrOOH as already named and mentioned in Table 1. When the electrode is prepared only using the as-obtained rGO sample (S0) and dried in air, graphitization of the rGO takes place; it not only reduces the interplanar separation between the planes but also converts rGO into a more graphitic structure and hence decreases the overall surface area available for charging and discharging of the supercapacitor. The electrodes prepared using various concentrations of CrOOH, such as 30, 50, and 70%, resulted in a high increase in the specific capacitance due to the following reasons. There are two phenomena occurring while increasing the concentration of CrOOH nanoparticles. First, as we increase the concentration of CrOOH (0 to 70%), it occupies the spaces at the surface and in between the distinct layers of rGO. It is worth mentioning that nanoparticles do not insert into the interlayer separation of graphene as the size of the nanoparticles is bigger than the interlayer separation of graphene, i.e., 0.335 nm. This not only increases the overall surface area of the composite but also maintains it by reducing the graphitization while drying the electrode material. The increment in surface area and ionization at the electrode–electrolyte interface results in higher charge storage and hence higher specific capacitance of the supercapacitor.38
Figure 7.
Plausible mechanism for the high performance of the S70 sample with 70% CrOOH and 30% rGO active material.
Second, as the concentration of CrOOH NPs increases up to a certain extent, i.e. more than 70%, simultaneously, the concentration of rGO decreases and the nanoparticles cover most of the surface area of rGO. Higher concentrations cover more and more of the rGO surface, resulting in a lower available overall graphene surface as well as poorer ionic conductivity for charging and discharging. As a result, this reduces the performance of the electrode material for supercapacitor devices, reaching the least when the concentration of rGO is zero.
For the overall performance, the energy density and power density of the device are also calculated. The energy density is calculated using the following equation
where Cs is the specific capacitance, taken from the CV curves (Figure 5a) at 5 mV s–1, and ΔV is the potential window. Also, for the calculation of power density, the following equation is used
where Δt is the rate of discharge of the cell.
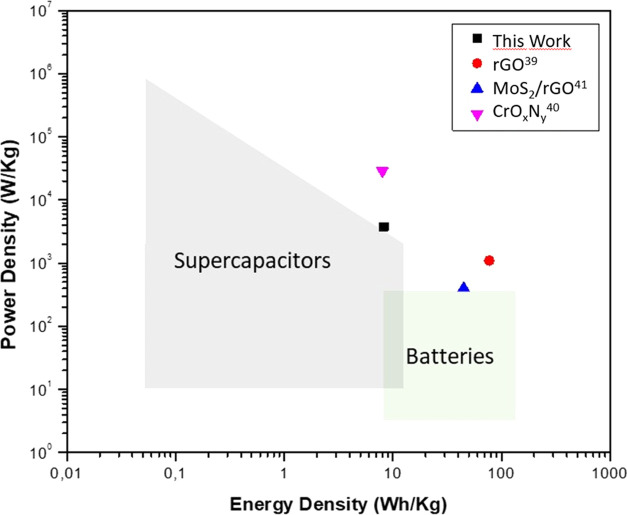
To compare the performance of the proposed device, considering all energy-storage devices, the results are plotted on a Ragone diagram, as shown in Figure 8. It can be clearly observed that the fabricated device with the proportion named as S70 has the typical characteristics of a supercapacitor, having a simultaneous high-power density (3756 W kg–1) and high energy density (8.26 Wh kg–1). The performances of other reported devices are also plotted against the proposed S70 device for comparison. In the same Ragone diagram, the corresponding values of other reported supercapacitors can also be observed, such as bare rGO,39 for a coin cell device fabricated with another form of chrome oxide (CrOxNy)40 and a flexible supercapacitor based on MoS2/rGO.41 It is evident that the energy density and power density values of our CrOOH/rGO coin cell device are higher and comparable to those of other devices42 made of similar materials, indicating that our device is a very good candidate for further study as a low-cost supercapacitor.
Figure 8.
Ragone Plot for the proposed and reported supercapacitor devices.39−41
4. Conclusions
CrOOH ultrasmall nanoparticles were synthesized in a facile way by utilizing ascorbic acid. A high-performance coin cell supercapacitor device is proposed, made up of electrode materials of CrOOH nanoparticles and rGO with an optimized ratio of 70 and 30%, respectively, which exhibited a high areal capacitance value of 199.8 mF cm–2. Furthermore, the device showed an excellent capacity retention and long cyclic stability up to 10,000 cycles tested. The values of energy and power densities, plotted in a Ragone diagram, are within the accepted range for capacitors, where the high energy density stands out. The supercapacitor fabricated and proposed in this work has a high efficiency and low cost, and is easy to manufacture and commercially viable. This method of synthesis of active materials by utilizing ascorbic acid as a reducing agent can be further exploited for various other graphene-based metal composites such as Au, Ag, and Cu.
Acknowledgments
This work was funded by ANID—Millennium Science Initiative Program—ICN17_012, ANID- Fondecyt Postdoctorado 3210225, and Dicyt USACH-5392104PS-ACDicyt.
The authors declare no competing financial interest.
References
- Liu C.; Li F.; Ma L.-P.; Cheng H.-M. Advanced Materials for Energy Storage. Adv. Mater. 2010, 22, E28–E62. 10.1002/adma.200903328. [DOI] [PubMed] [Google Scholar]
- Ma Y.; Chang H.; Zhang M.; Chen Y. Graphene-Based Materials for Lithium-Ion Hybrid Supercapacitors. Adv. Mater. 2015, 27, 5296–5308. 10.1002/adma.201501622. [DOI] [PubMed] [Google Scholar]
- Shao Y.; El-Kady M. F.; Sun J.; Li Y.; Zhang Q.; Zhu M.; Wang H.; Dunn B.; Kaner R. B. Design and Mechanisms of Asymmetric Supercapacitors. Chem. Rev. 2018, 118, 9233–9280. 10.1021/acs.chemrev.8b00252. [DOI] [PubMed] [Google Scholar]
- Lang J.; Jin Y.; Liu K.; Long Y.; Zhang H.; Qi L.; Wu H.; Cui Y. High-Purity Electrolytic Lithium Obtained from Low-Purity Sources Using Solid Electrolyte. Nat. Sustainability 2020, 3, 386–390. 10.1038/s41893-020-0485-x. [DOI] [Google Scholar]
- Li B.; Wu J.; Lu J. Life Cycle Assessment Considering Water-Energy Nexus for Lithium Nanofiltration Extraction Technique. J. Cleaner Prod. 2020, 261, 121152 10.1016/j.jclepro.2020.121152. [DOI] [Google Scholar]
- Long J. W.; Brousse T.; Bélanger D. Electrochemical Capacitors: Fundamentals to Applications. J. Electrochem. Soc. 2015, 162, Y3 10.1149/2.0261505jes. [DOI] [Google Scholar]
- Liu C.; Yu Z.; Neff D.; Zhamu A.; Jang B. Z. Graphene-Based Supercapacitor with an Ultrahigh Energy Density. Nano Lett. 2010, 10, 4863–4868. 10.1021/nl102661q. [DOI] [PubMed] [Google Scholar]
- Iro Z. S. A Brief Review on Electrode Materials for Supercapacitor. Int. J. Electrochem. Sci. 2016, 10628–10643. 10.20964/2016.12.50. [DOI] [Google Scholar]
- Jiang J.; Zhang Y.; Nie P.; Xu G.; Shi M.; Wang J.; Wu Y.; Fu R.; Dou H.; Zhang X. Progress of Nanostructured Electrode Materials for Supercapacitors. Adv. Sustainable Syst. 2018, 2, 1700110 10.1002/adsu.201700110. [DOI] [Google Scholar]
- Cui M.; Meng X. Overview of Transition Metal-Based Composite Materials for Supercapacitor Electrodes. Nanoscale Adv. 2020, 2, 5516–5528. 10.1039/d0na00573h. [DOI] [PMC free article] [PubMed] [Google Scholar]
- Chen B.; Wang Y.; Li C.; Fu L.; Liu X.; Zhu Y.; Zhang L.; Wu Y. A Cr2O3/MWCNTs Composite as a Superior Electrode Material for Supercapacitor. RSC Adv. 2017, 7, 25019–25024. 10.1039/c7ra01954h. [DOI] [Google Scholar]
- Li T.; Liu Z.; Zhu L.; Dai F.; Hu L.; Zhang L.; Wen Z.; Wu Y. Cr2O3 Nanoparticles: A Fascinating Electrode Material Combining Both Surface-Controlled and Diffusion-Limited Redox Reactions for Aqueous Supercapacitors. J. Mater. Sci. 2018, 53, 16458–16465. 10.1007/s10853-018-2743-0. [DOI] [Google Scholar]
- Ullah S.; Khan I. A.; Choucair M.; Badshah A.; Khan I.; Nadeem M. A. A Novel Cr2O3-Carbon Composite as a High Performance Pseudo-Capacitor Electrode Material. Electrochim. Acta 2015, 171, 142–149. 10.1016/j.electacta.2015.04.179. [DOI] [Google Scholar]
- Xu X.; Wu J.; Yang N.; Na H.; Li L.; Gao J. Cr2O3: A Novel Supercapacitor Electrode Material with High Capacitive Performance. Mater. Lett. 2015, 142, 172–175. 10.1016/j.matlet.2014.12.022. [DOI] [Google Scholar]
- Pardo P.; Calatayud J. M.; Alarcón J. Chromium Oxide Nanoparticles with Controlled Size Prepared from Hydrothermal Chromium Oxyhydroxide Precursors. Ceram. Int. 2017, 43, 2756–2764. 10.1016/j.ceramint.2016.11.104. [DOI] [Google Scholar]
- Gao M.; Ma N.; Yu C.; Liu Y. In Situ Synthesis of Fe-Doped CrOOH Nanosheets for Efficient Electrocatalytic Water Oxidation. Nanotechnology 2021, 32, 28LT01 10.1088/1361-6528/abf210. [DOI] [PubMed] [Google Scholar]
- Marcano D. C.; Kosynkin D. V.; Berlin J. M.; Sinitskii A.; Sun Z.; Slesarev A.; Alemany L. B.; Lu W.; Tour J. M. Improved Synthesis of Graphene Oxide. ACS Nano 2010, 4, 4806–4814. 10.1021/nn1006368. [DOI] [PubMed] [Google Scholar]
- Liang S.-t.; Zhang H.; Luo M.; Luo K.; Li P.; Xu H.; Zhang Y. Colour Performance Investigation of a Cr2O3 Green Pigment Prepared via the Thermal Decomposition of CrOOH. Ceram. Int. 2014, 40, 4367–4373. 10.1016/J.CERAMINT.2013.08.107. [DOI] [Google Scholar]
- Robić M.; Ristić M.; Krehula S.; Jurić M.; Musić S. Synthesis of Nanocrystalline Eskolaite via Grimaldiite. Chem. Pap. 2021, 75, 735–741. 10.1007/s11696-020-01338-4. [DOI] [Google Scholar]
- Liu J.; Liu B.; Yuan L.; Li B.; Xie L.; Chen X.; Zhang H.; Xu D.; Tong W.; Wang J.; Li Y. Frustrated Magnetism of the Triangular-Lattice Antiferromagnets α-CrOOH and α-CrOOD OPEN ACCESS RECEIVED Frustrated Magnetism of the Triangular-Lattice Antiferromagnets α-CrOOH and α-CrOOD. New J. Phys. 2021, 23, 033040 10.1088/1367-2630/abe813. [DOI] [Google Scholar]
- Tauc J.; Grigorovici R.; Vancu A. Optical Properties and Electronic Structure of Amorphous Germanium. Phys. Status Solidi (b) 1966, 15, 627–637. 10.1002/PSSB.19660150224. [DOI] [Google Scholar]
- Kohler K.; Maciejewski M.; Schneider H.; Baiker A. Chromia Supported on Titania. J. Catal. 1995, 157, 301–311. 10.1006/jcat.1995.1295. [DOI] [Google Scholar]
- Stankovich S.; Dikin D. A.; Piner R. D.; Kohlhaas K. A.; Kleinhammes A.; Jia Y.; Wu Y.; Nguyen S. B. T.; Ruoff R. S. Synthesis of Graphene-Based Nanosheets via Chemical Reduction of Exfoliated Graphite Oxide. Carbon 2007, 45, 1558–1565. 10.1016/J.CARBON.2007.02.034. [DOI] [Google Scholar]
- Mohan V. B.; Nieuwoudt M.; Jayaraman K.; Bhattacharyya D. Quantification and Analysis of Raman Spectra of Graphene Materials. Graphene Technol. 2017, 2, 47–62. 10.1007/S41127-017-0012-7. [DOI] [Google Scholar]
- Alam S. N.; Sharma N.; Kumar L. Synthesis of Graphene Oxide (GO) by Modified Hummers Method and Its Thermal Reduction to Obtain Reduced Graphene Oxide (RGO)*. Graphene 2017, 06, 1–18. 10.4236/GRAPHENE.2017.61001. [DOI] [Google Scholar]
- Abdolhosseinzadeh S.; Asgharzadeh H.; Kim H. S. Fast and Fully-Scalable Synthesis of Reduced Graphene Oxide. Sci. Rep. 2015, 5, 10160 10.1038/srep10160. [DOI] [PMC free article] [PubMed] [Google Scholar]
- De Oliveira P. F. M.; Michalchuk A. A. L.; Marquardt J.; Feiler T.; Prinz C.; Torresi R. M.; Camargo P. H. C.; Emmerling F. Investigating the Role of Reducing Agents on Mechanosynthesis of Au Nanoparticles. CrystEngComm 2020, 22, 6261–6267. 10.1039/D0CE00826E. [DOI] [Google Scholar]
- Leybo D.; Tagirov M.; Permyakova E.; Konopatsky A.; Firestein K.; Tuyakova F.; Arkhipov D.; Kuznetsov D. Ascorbic Acid-Assisted Polyol Synthesis of Iron and Fe/GO, Fe/h-BN Composites for Pb2+ Removal from Wastewaters. Nanomaterials 2020, 10, 37 10.3390/NANO10010037. [DOI] [PMC free article] [PubMed] [Google Scholar]
- Vivas L.; Chi-Duran I.; Enríquez J.; Barraza N.; Singh D. P. Ascorbic Acid Based Controlled Growth of Various Cu and Cu 2 O Nanostructures. Mater. Res. Express 2019, 6, 065033 10.1088/2053-1591/ab0dd2. [DOI] [Google Scholar]
- Stoller M. D.; Ruoff R. S. Best Practice Methods for Determining an Electrode Material’s Performance for Ultracapacitors. Energy Environ. Sci. 2010, 3, 1294–1301. 10.1039/c0ee00074d. [DOI] [Google Scholar]
- Zhang S.; Pan N. Supercapacitors Performance Evaluation. Adv. Energy Mater. 2015, 5, 1401401 10.1002/aenm.201401401. [DOI] [Google Scholar]
- Azman N. H. N.; Nazir M. S. M. M.; Ngee L. H.; Sulaiman Y. Graphene-Based Ternary Composites for Supercapacitors. Int. J. Energy Res. 2018, 42, 2104–2116. 10.1002/er.4001. [DOI] [Google Scholar]
- Demarconnay L.; Raymundo-Piñero E.; Béguin F. A Symmetric Carbon/Carbon Supercapacitor Operating at 1.6 v by Using a Neutral Aqueous Solution. Electrochem. Commun. 2010, 12, 1275–1278. 10.1016/j.elecom.2010.06.036. [DOI] [Google Scholar]
- Aytug T.; Rager M. S.; Higgins W.; Brown F. G.; Veith G. M.; Rouleau C. M.; Wang H.; Hood Z. D.; Mahurin S. M.; Mayes R. T.; Joshi P. C.; Kuruganti T. Vacuum-Assisted Low-Temperature Synthesis of Reduced Graphene Oxide Thin-Film Electrodes for High-Performance Transparent and Flexible All-Solid-State Supercapacitors. ACS Appl. Mater. Interfaces 2018, 10, 11008–11017. 10.1021/acsami.8b01938. [DOI] [PubMed] [Google Scholar]
- Rakhi R. B.; Chen W.; Cha D.; Alshareef H. N. Substrate Dependent Self-Organization of Mesoporous Cobalt Oxide Nanowires with Remarkable Pseudocapacitance. Nano Lett. 2012, 12, 2559–2567. 10.1021/nl300779a. [DOI] [PubMed] [Google Scholar]
- Song Y.; Zhang J.; Guo H.; Chen X.; Su Z.; Chen H.; Cheng X.; Zhang H. All-Fabric-Based Wearable Self-Charging Power Cloth. Appl. Phys. Lett. 2017, 111, 073901 10.1063/1.4998426. [DOI] [Google Scholar]
- Zhang J.; Zhang Z.; Jiao Y.; Yang H.; Li Y.; Zhang J.; Gao P. The Graphene/Lanthanum Oxide Nanocomposites as Electrode Materials of Supercapacitors. J. Power Sources 2019, 419, 99–105. 10.1016/j.jpowsour.2019.02.059. [DOI] [Google Scholar]
- Lee J. L.; Park N.; Kim B. G.; Jung D. S.; Im K.; Hur J.; Choi J. W. Restacking-Inhibited 3D Reduced Graphene Oxide for High Performance Supercapacitor Electrodes. ACS Nano 2013, 7, 9366–9374. 10.1021/nn4040734. [DOI] [PubMed] [Google Scholar]
- Poochai C.; Sriprachuabwong C.; Srisamrarn N.; Chuminjak Y.; Lomas T.; Wisitsoraat A.; Tuantranont A. High Performance Coin-Cell and Pouch-Cell Supercapacitors Based on Nitrogen-Doped Reduced Graphene Oxide Electrodes with Phenylenediamine-Mediated Organic Electrolyte. Appl. Surf. Sci. 2019, 489, 989–1001. 10.1016/j.apsusc.2019.05.330. [DOI] [Google Scholar]
- Kumar U. N.; Ramavath J. N.; Ghosh S.; Kothandaraman R.; Thomas T. Chromium Oxynitride as Durable Electrode Material for Symmetric Supercapacitors. Batteries Supercaps 2020, 3, 780–788. 10.1002/batt.201900225. [DOI] [Google Scholar]
- Gowrisankar A.; Saravanakumar T.; Selvaraju T.. Graphene-Based Composite Materials for Flexible Supercapacitors. In Nanostructured, Functional, and Flexible Materials for Energy Conversion and Storage Systems; Elsevier, 2020; pp 345–372. [Google Scholar]
- Vivas L.; Singh D. P. A Highly Efficient Graphene Gold Based Green Supercapacitor Coin Cell Device for Energy Storage. Front. Energy Res. 2022, 9, 906 10.3389/fenrg.2021.794604. [DOI] [Google Scholar]


