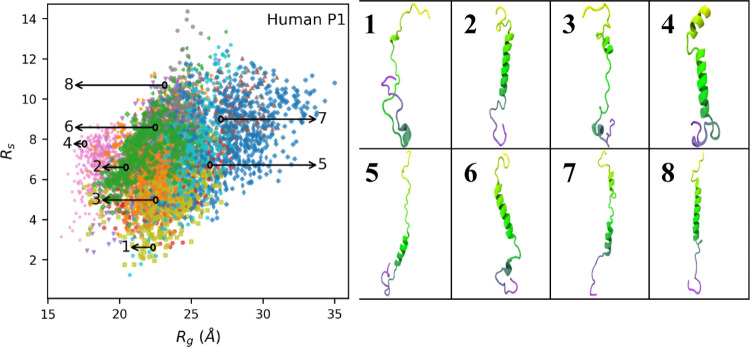
Figure 4.
Scatter plot of shape ratio (Rs) vs radius of gyration (Rg) for human P1 protamine. Each data point represents Rg and Rs values in single frames that were collected every 200 ps. The 13 individual trajectories are coded by different colors. Conformation images for numbered snapshots are shown on the right.

