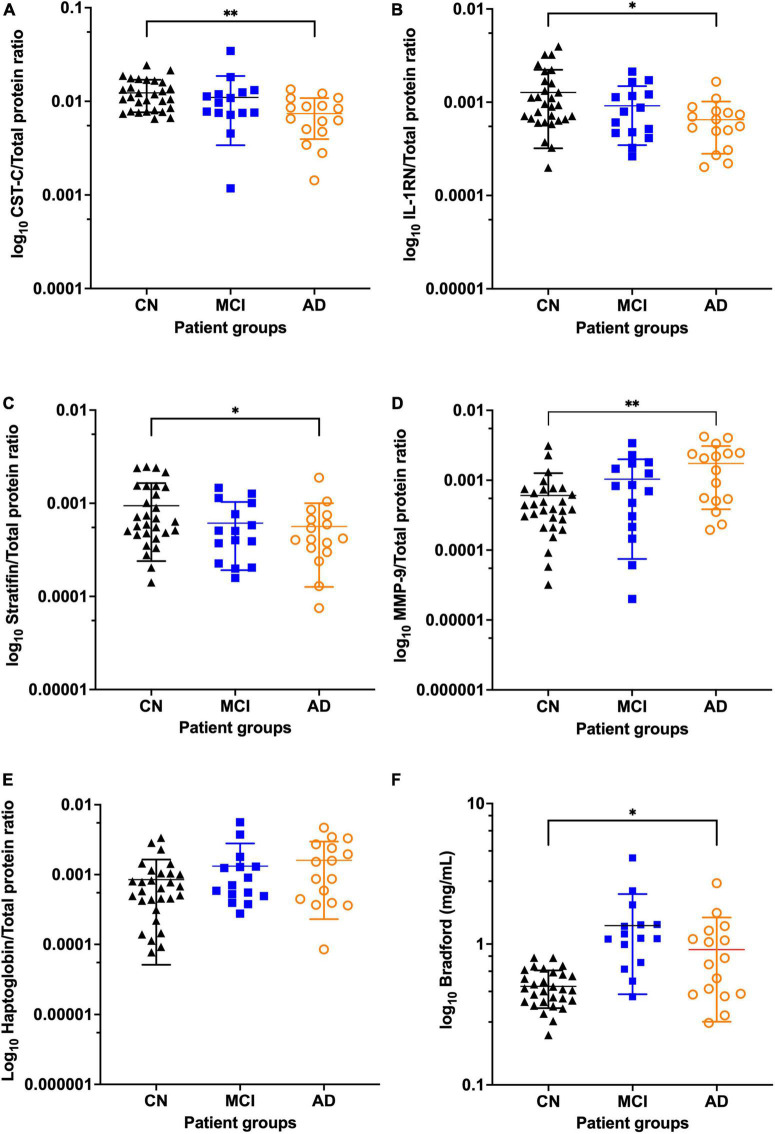
FIGURE 1.
Levels of total protein and five biomarkers in the SANDs cohort showing reduced abundance of CST-C, IL-1RN, and SFN in MCI and AD and increased abundance of total protein, MMP-9 and HP in MCI and AD. Scatter dot plots show the mean, standard deviation and all points for each biomarker adjusted for total protein with AD in orange (n = 16), MCI in blue (n = 15) and CN in black (n = 29) for (A) CST-C (B) IL-1RN (C) SFN (D) MMP-9 (E) Hp (F) Total protein. *Unadjusted p-values shown from log transformed data for cohorts CN vs. AD with *P < 0.05 and **P < 0.01. AD, Alzheimer’s disease; CN, Cognitively Normal; CST-C, Cystatin-C; Hp, Haptoglobin; IL-1RN, Interleukin-1 receptor antagonist protein; Matrix metalloproteinase 9, MMP-9; MCI, Mild cognitive impairment; SFN, Stratifin.

