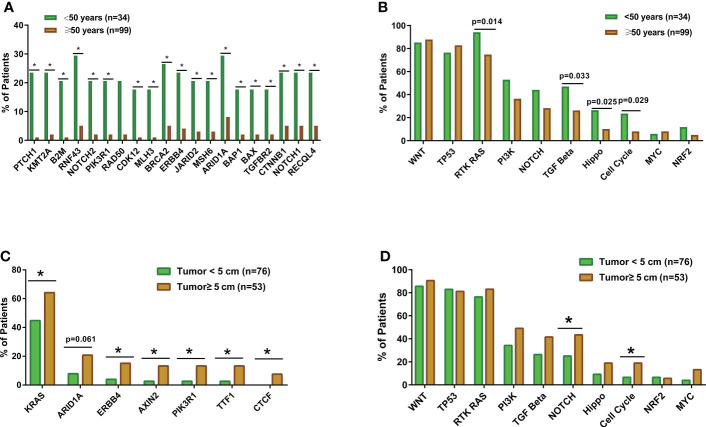
Figure 2.
The comparisons of somatic mutation and pathway alteration characteristics between colorectal cancer patients with different tumor sizes and ages. (A) The bar plots comparing gene alteration rates in early-onset (N=34) and late-onset patients (N=99). (B) The bar plots comparing pathway alteration rates in early-onset (N=34) and late-onset patients (N=99). (C) The bar plots comparing gene alteration rates patients with small tumor size (tumor diameter smaller than 5cm, N=76) and large tumor size (tumor diameter equal or larger than 5cm, N=53). (D) The bar plots comparing pathway alteration rates patients with small tumor size (tumor diameter smaller than 5cm, N=76) and large tumor size (tumor diameter equal or larger than 5cm, N=53). *p < 0.05.

