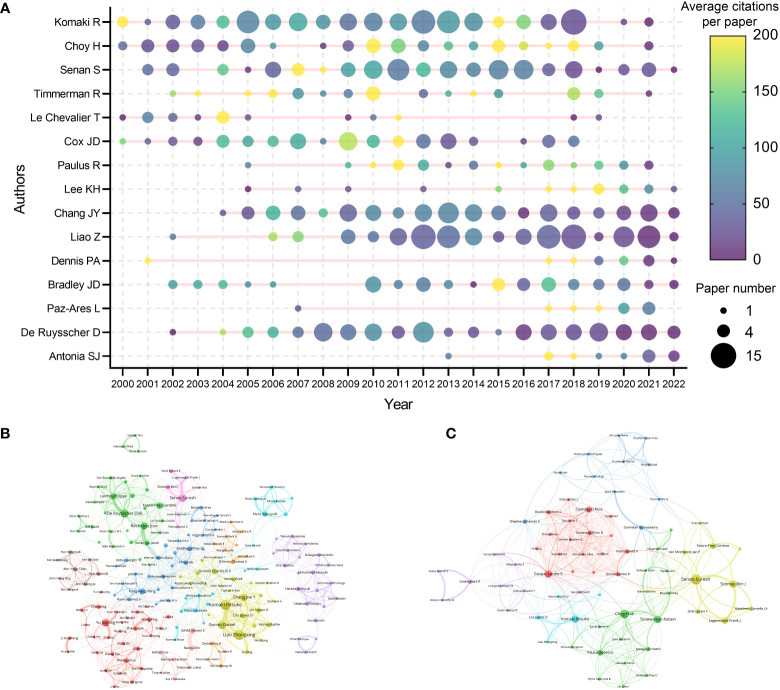
Figure 5.
(A) The top-15 cited authors’ production and citation over time. The node size represents the paper number and the color represents the average citations per paper. (B) Network visualization of authors with at least 20 papers related to lung cancer radiotherapy. (C) Network visualization of authors with at least 2 top-papers related to lung cancer radiotherapy. The circle size represents the number of papers. The breadth of the curves represents the connection strength. The authors in the same color have stronger collaboration with each other.

