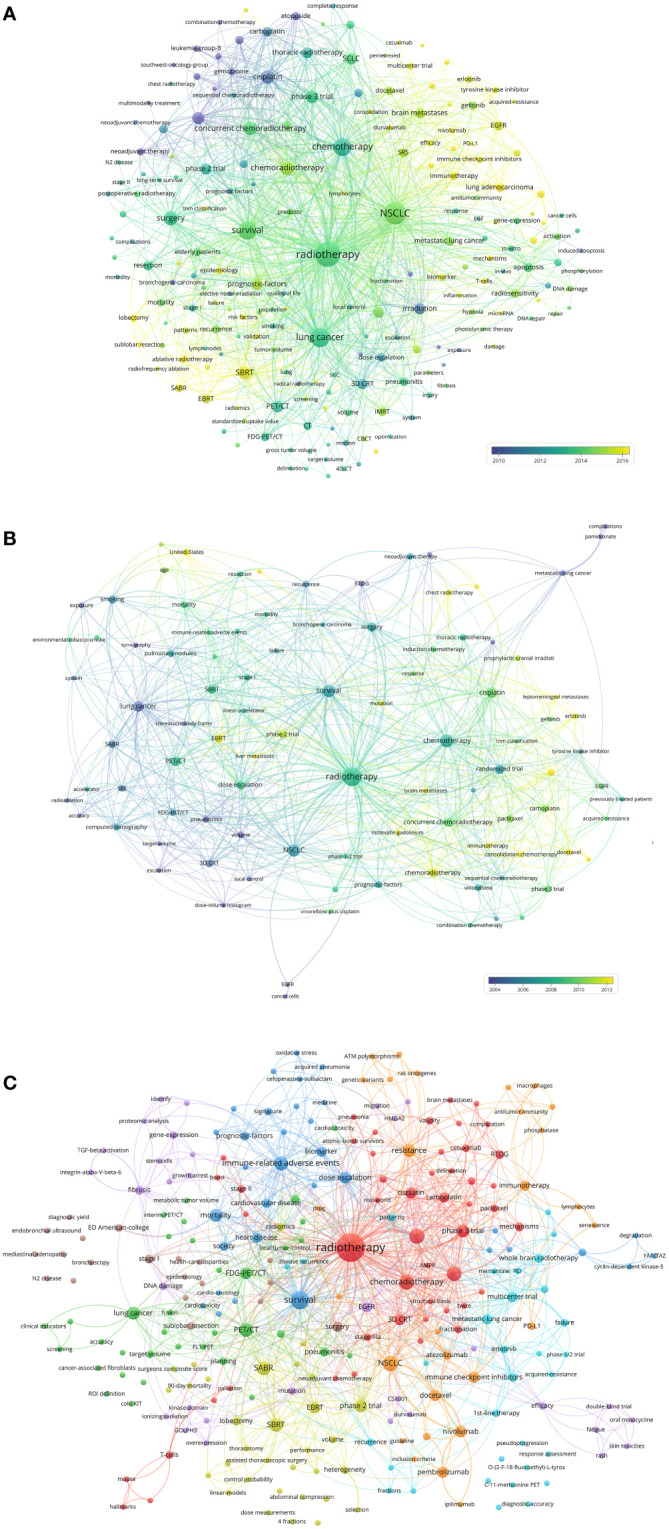
Figure 6.

(A) Network visualization of keywords that occurred at least 50 times in the 9868 articles. (B) Network visualization of keywords that occurred at least twice in the top-papers. (C) Network visualization of keywords in articles published in top-journals between 2020 and 2022. The circle size represents the number of papers. The breadth of the curves represents the connection strength.
