Fig. 2.
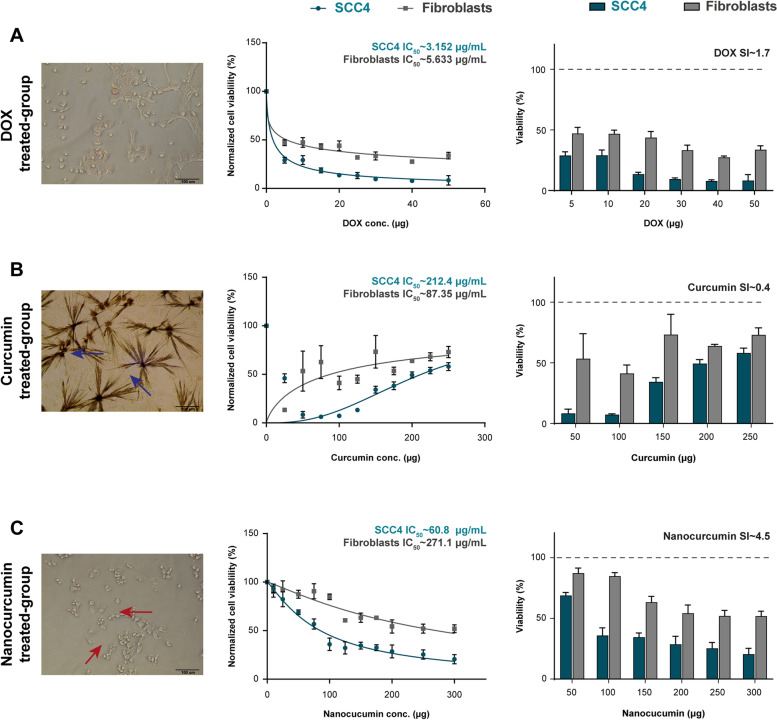
The cytotoxic effects of the proposed treatments on cancer SCC4 and normal gingival cells, where nanocurcumin shows tumor cell specificity by 4.5. A The phase-contrast morphology of DOX-treated SCC4 shows small rounded detached cells with pyknotic nuclei and thin perinuclear cytoplasmic rims. The dose-dependent curve and the bar chart reveal the sharp drop of IC50 to ~ 3.1 µg/mL for SCC4 versus ~ 5.6 µg/mL for gingival cells. B The inverted light microscope photomicrograph of the curcumin-treated SCC4 demonstrates the distinctive crystalline form of curcumin (blue arrows), which hinders its cytotoxic effects, a reflected picture in the cell viability dose curve and plot chart. Upon increasing curcumin concentration, the SCC4 cells regain their viability due to the formation of the crystals with IC50 of ~ 212.4 µg/mL. C Nanocurcumin-treated SCC4 cells show the blebs (red arrows) formed on the cell surface, denoting the generation of apoptotic bodies. The bar chart reveals the gradual decrease in SCC4 cell viability, where the IC50 curve confirms the dose-dependent cytotoxic effect of nanocurcumin, calculating ~ 60.8 µg/mL. Data presentation is as mean ± SD of three independent experiments. The digital microscopic photomicrographs are captured using Olympus CKX41 phase-contrast microscope at × 200 of a scale bar 100 µm

