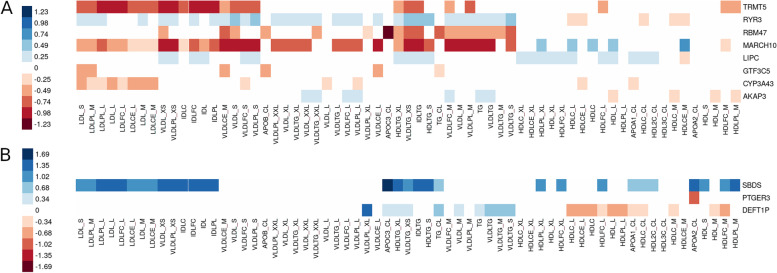
Fig. 3.
Associations across all studied lipid phenotypes for the lead genes. Only nominally significant associations (WES-WGS SKAT meta-analysis p<0.05) are shown. The color indicates the effect size estimate of the gene–phenotype association calculated with a burden test meta-analysis for normalized distributions assuming same effect direction for all variants. A WES-WGS PAV meta-analysis across phenotypes. B WES-WGS PTV meta-analysis across phenotypes. The phenotypes are ordered according to their similarity in clustering of the phenotype data

