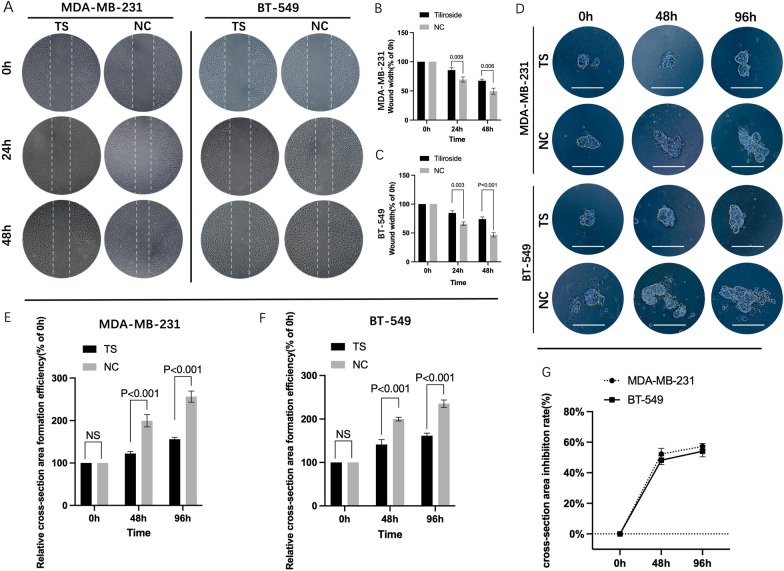
Fig. 3.
TS inhibited the migration and 3D formation abilities of TNBC cells. The wound healing assay was performed in MDA-MB-231 and BT-549 cells (A). The bar graphics present the percentage of wound recovery in both cell lines, respectively. In MDA-MB-231, the average width of wound gaps in the TS group was 85.66 ± 3.26% of its initial width compared to its counterpart in NC group (69.57 ± 3.56%, P = 0.009), at 24 h, and its 67.39 ± 2.14% compared to 49.52 + 4.29%, at 48 h (P = 0.006) (B). Similar results were detected in BT-549 cells (C). The representative 3D spheroid models of TNBC cells (D). In MDA-MB-231 cells, the relative cell cross-section area of TS group was 122.33 ± 4.03% compared to199.67 ± 11.9% of NC group, at 48 h (P < 0.001), and 156 ± 3.74% compared to 256.27 ± 10.73% at 96 h (P = 0.006) (E). Similar trends were also observed in BT-549 cells (F). The inhibition rates of MDA-MB-231 cells ranged from 52.29 ± 3% to 57.24 ± 1.61%, at 48 and 96 h, and that of BT-549 were 48.21 ± 2.36% to 54.1 ± 3%, by calculating the fluorescence values of 3D formation cell (G). NC negative control

