
Figure 4.
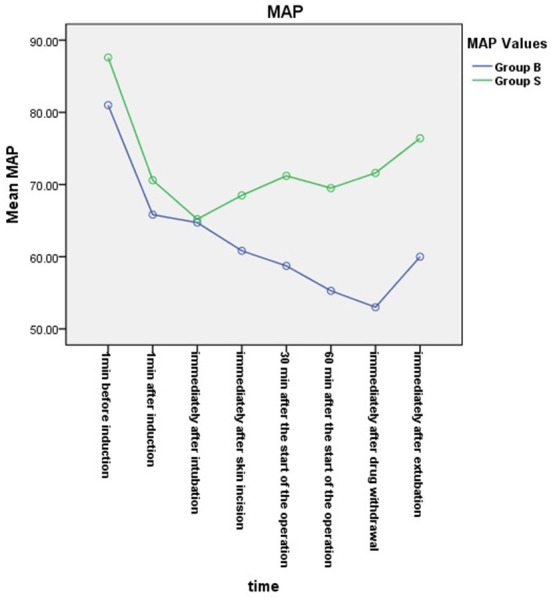
Mean arterial pressure (MAP) changes in the two groups. The MAP values significantly differed among the eight time points as well as between the two groups (P < 0.05). MAP in group B was lower than in group S at 30 min after the start of the operation, 60 min after the start of operation, immediately after drug withdrawal, and immediately after extubation (P < 0.05).