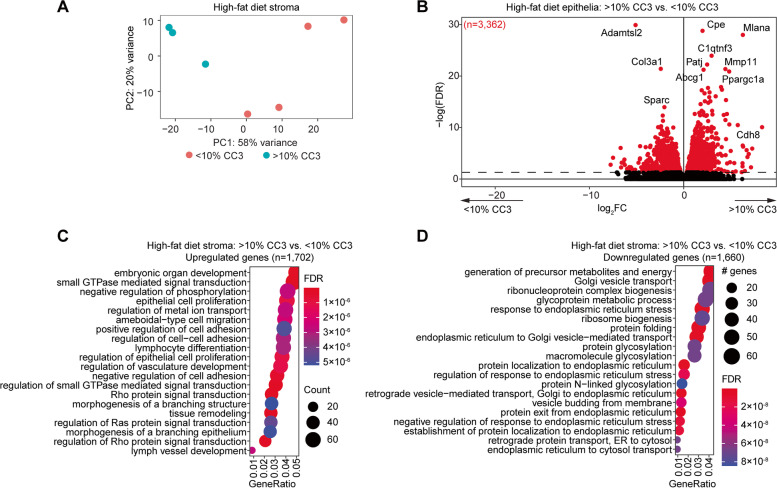
Fig. 9.
Differential stroma expression profiles among mice with apoptotic luminal epithelia. A Principal component analysis of gene expression data from high-fat diet endometrial stroma based on luminal epithelia CC3, > 10% or < 10%. B Volcano plot of expressed genes in stroma of two groups. Significant differentially expressed genes (FDR < 0.05) among > 10% CC3 epithelia compared to < 10% CC3 epithelia are highlighted in red. Genes with FDR < 0.001 are denoted with gene symbols. C,D Enrichment analysis for GO biological processes for upregulated genes (n = 1,702) (C) or downregulated genes (n = 1,660) (D)

