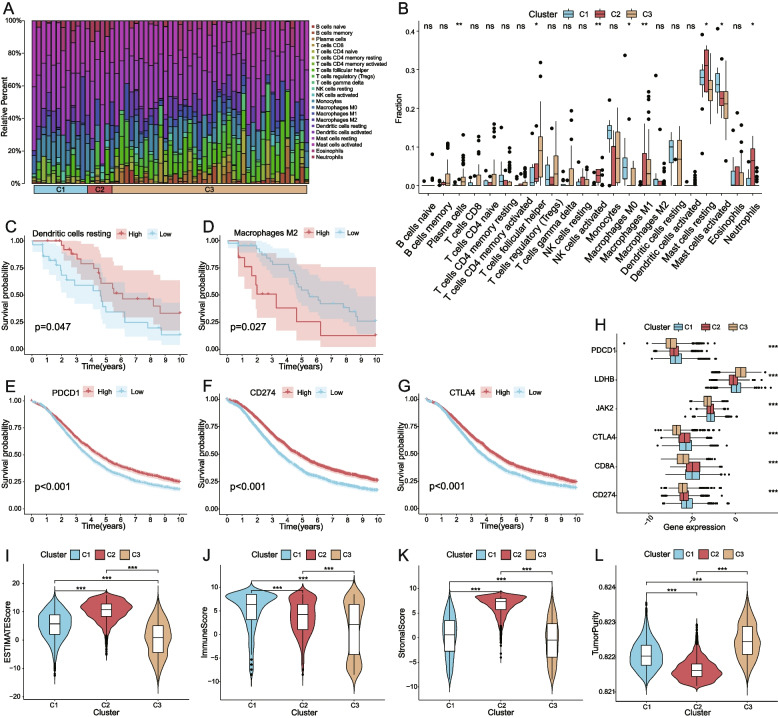
Fig. 5.
Analysis of the TME, immune cell infiltration and immune checkpoints. A The proportion of 22 immune cells built on 3 clusters; B The difference of the fraction of 22 immune cells in 3 clusters; C The relationship between the proportion of dendritic cells resting and survival; D The relationship between the proportion of macrophages M2 cells and survival; E-G The relationship between the expression level of PDCD1, CD274, CTLA4 and survival; H The expression of 6 immune checkpoint genes with significant differences among the 3 clusters; I-L The ESTIMATE Score, Immune Score, Stromal Score, Tumor Purity were significantly different between 3 clusters. (*p < 0.05, **p < 0.01, ***p < 0.001, ns: nonsignificance)

