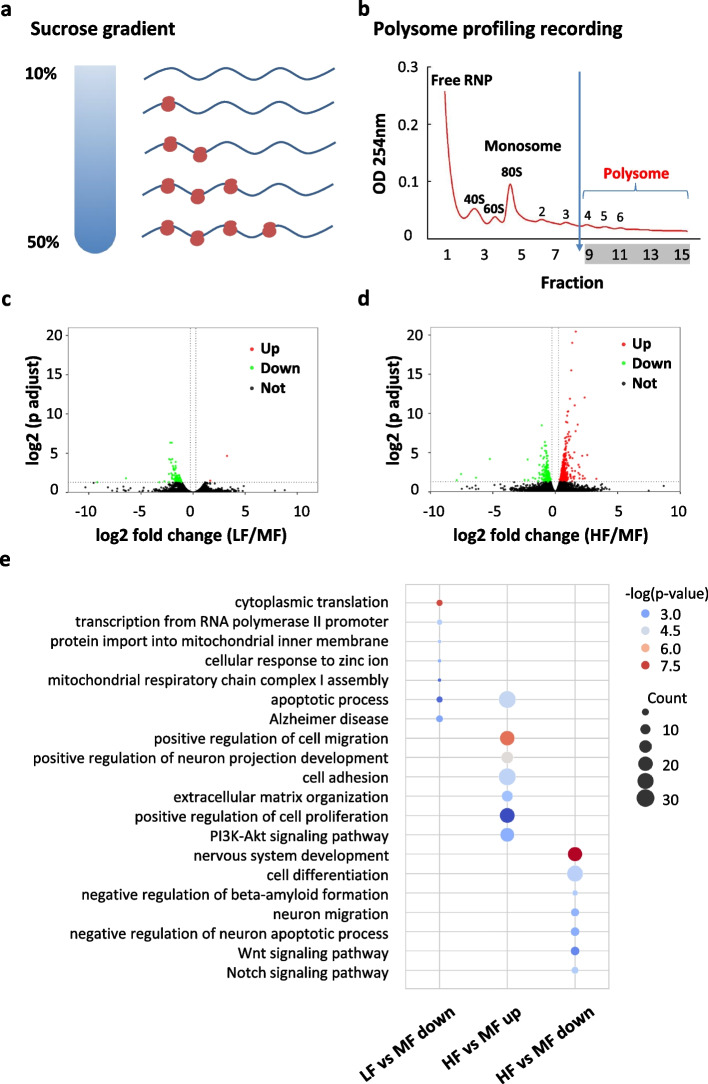
Fig. 4.
Folate deficiency and supplementation influence mRNA translation in NSCs. a, b Schematic representation of the sucrose gradient used to segregate ribosome-free and ribosome-bound RNAs (a) and representative polysome profile (1.5μM FA, replicate 1) recorded at 254 nm, polysome fraction (portion 9 to 15) is indicated (b). c Volcano plot showing the differentially translated genes (DTGs) in comparison between LF and MF. d Volcano plot showing the differentially translated genes (DTGs) in comparison between HF and MF. e Bubble plot showing the GO terms of the DTGs: decreased translation efficiency in LF (LF vs MF down), decreased translation efficiency in HF (HF vs MF down), and increased translation efficiency in HF (HF vs MF up)

