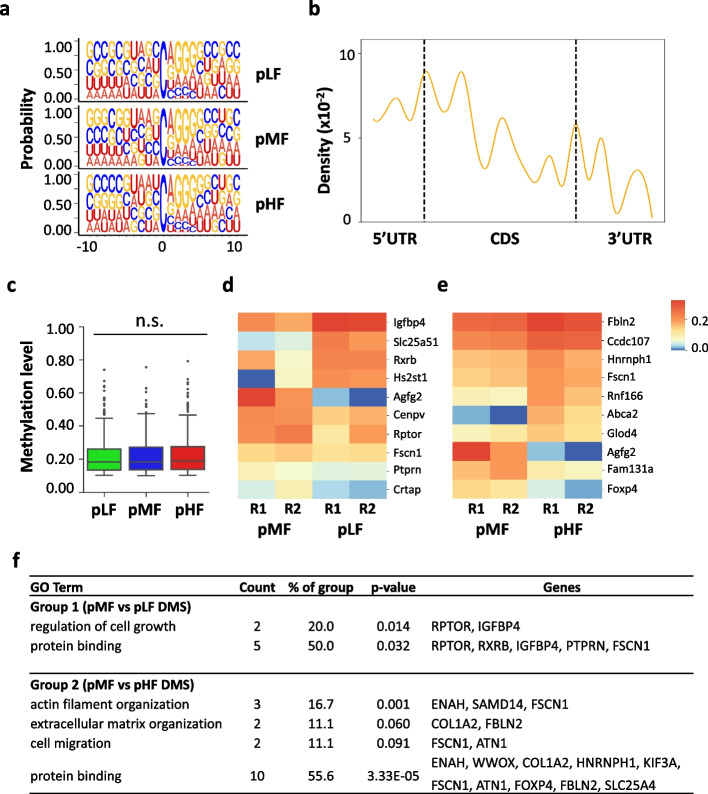
Fig. 5.
Influence of folate on polysome mRNA m5C methylation in mouse NSCs. a Sequence frequency logo for the sequence context proximal to m5C sites in polysome mRNAs. b Density plot showing the distribution of m5C sites along mRNA transcripts (5′UTR, CDS, 3′UTR). The moving average of the percentage is shown. c Boxplot showing the methylation levels of m5C sites in polysome mRNAs. d Heatmap showing the methylation level of differentially methylated m5C sites in comparison between pMF and pLF. Two biological replicates (R1, R2) are shown. e Heatmap showing the methylation level of differentially methylated m5C sites in comparison between pMF and pHF. Two biological replicates (R1, R2) are shown. f GO annotation of DMS-modified mRNAs of pMF vs pLF and pMF vs pHF. Representative GO terms are shown in the table

