Figure 5.
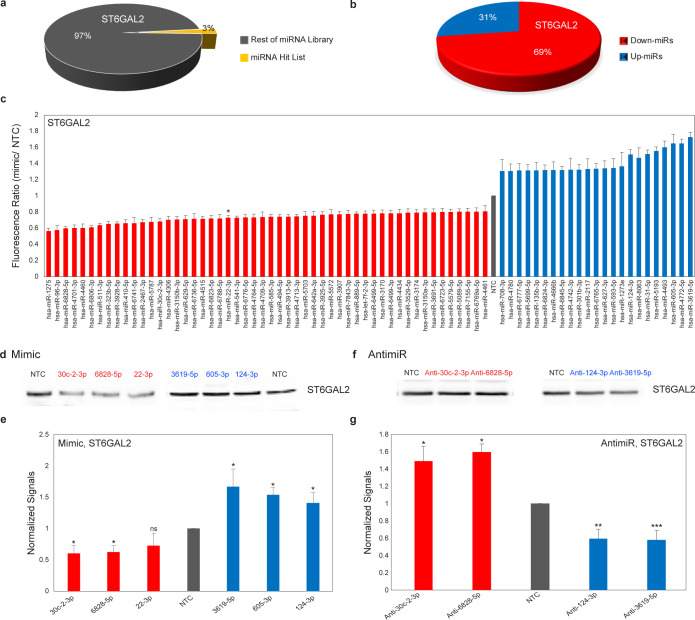
miRNAs regulate ST6GAL2 expression at mRNA and protein levels. (a and b) Pie charts for ST6GAL2 as in Figure 2b–c. (c) Bar graph for ST6GAL2 as in Figure 2d. Star represents a known hit.42 (d) Western blot of ST6GAL2. A549 cells were treated with miRNAs as in Figure 3b. (e) Quantitation of Western blot analysis. (f) Western blot analysis of ST6GAL2. A549 cells were treated with antimiRs as in Figure 4b. (g) Quantitative Western blot analysis. Additional data are shown in Supporting Information Figures S10–S11. All experiments were performed in biological triplicate. Errors shown are standard deviations. Paired t test was used to compare miRs to NTC (ns not significant, * p < 0.05, ** < 0.01, *** < 0.001).

