Figure 6.
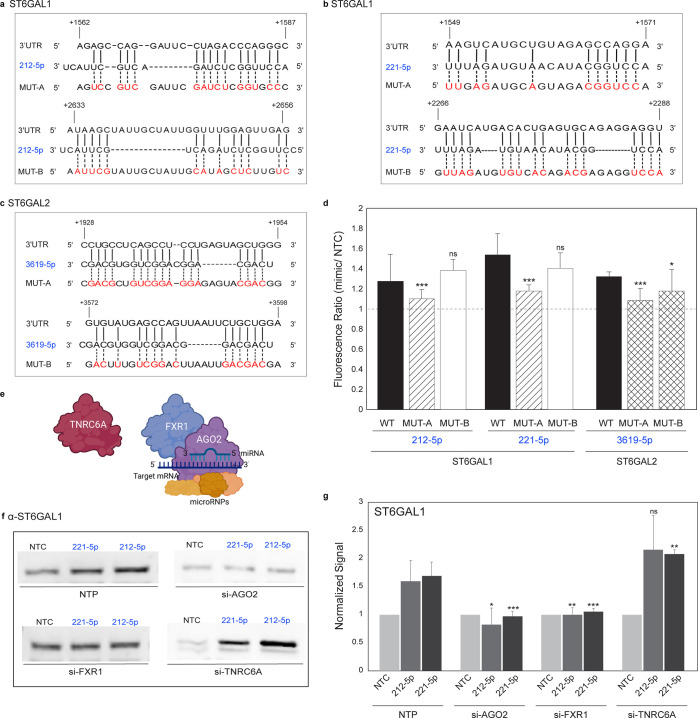
Upregulation of expression by miRNAs requires direct interaction with 3′UTR within a complex containing AGO2 and FXR1. (a and b) Alignment of miRs (a: 212-5p, b: 221-5p) with predicted ST6GAL1-3′-UTR sites and their corresponding mutants. Mutated residues are shown in red. (c) Alignment of miR-3619-5p with predicted ST6GAL2-3′-UTR sites and their corresponding mutants. Mutated residues are shown in red. (d) Bar graph of data from mutant miRFluR sensors as in b and c. Data were normalized over NTC in each sensor. Statistical analysis using the standard t test compared the impact of each miRNA in the wild-type (WT) sensor with the corresponding mutant. (e) Schematic representation of potential miRNA complex. (f) Representative Western blot of ST6GAL1. A549 cells were treated with pools of siRNA (nontargeting (NTP), si-AGO2, si-FXR1, si-TNRC6A, 48 h) prior to treatment with miRNA mimics (NTC, miR-212-5p, miR-221-5p, 48 h) and analysis. (g) Quantitative Western blot analysis of experiment shown in f. ST6GAL1 expression normalized as before. All experiments were performed in biological triplicate. Errors are standard deviations. Standard t test was used to compare the impact of miRNA in knockdowns with impact in NTP (ns not significant, * p < 0.05, ** < 0.01, *** < 0.001). Additional data are shown in Supporting Information Figures S12–S14.

