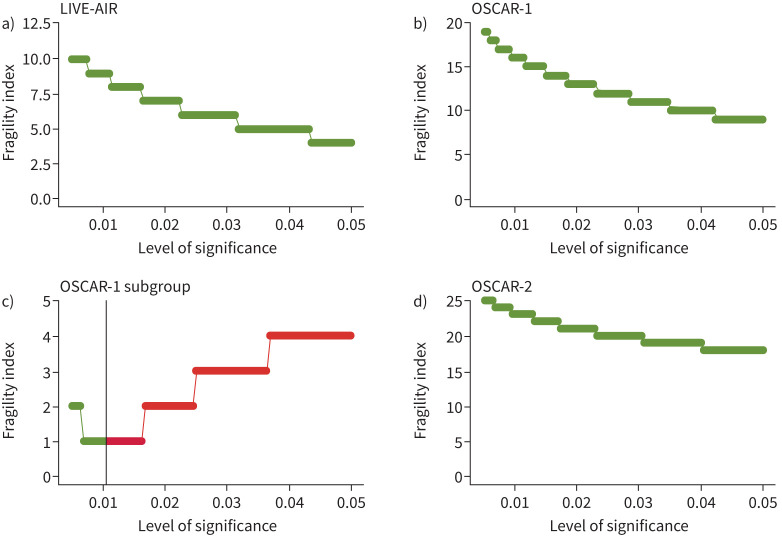
FIGURE 1.
Plots of fragility index (y-axis) for each level of significance. a) LIVE-AIR study, b) OSCAR trial part one main cohort, c) OSCAR part one, subgroup ≥70 years old, and d) OSCAR part two. Green shows the areas of non-significance and red significance based on the level indicated on the x-axis based on Fisher's exact method. In panel c the vertical line indicates the p-value of the subgroup analysis.

