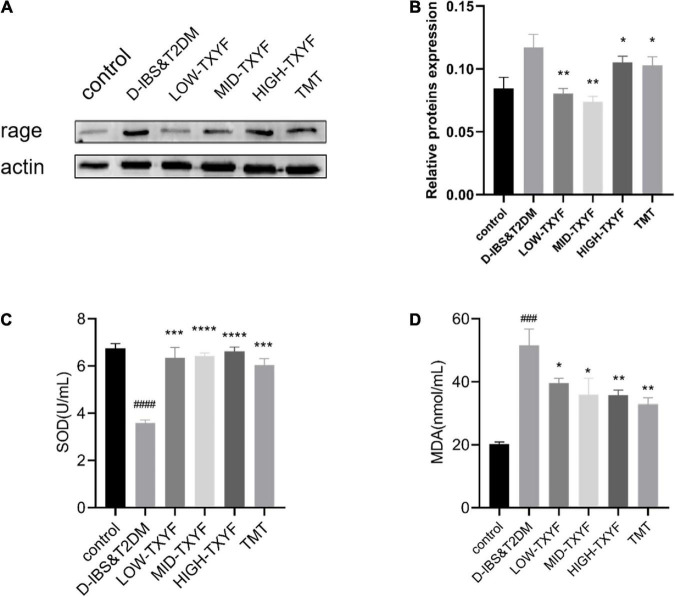
FIGURE 6.
Protein expression level of RAGE was measured using western blotting (n = 3) (A,B). Effects of TXYF on SOD and MDA in serum in rats with D-IBS&T2DM. Values are presented as means ± SD (n = 3), ###P < 0.001 and ####P < 0.0001 compared with the control group; *P < 0.05, **P < 0.01, ***P < 0.001, and ****P < 0.0001 compared with the D-IBS&T2DM group (C,D).

