Figure 1.
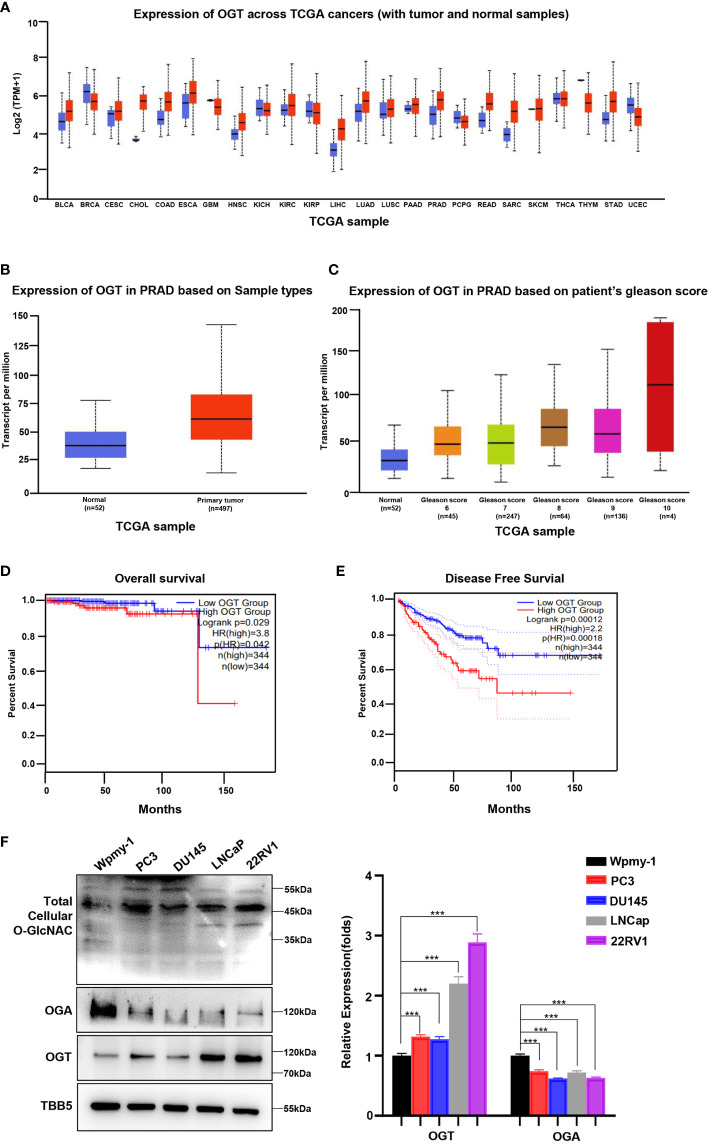
OGT is overexpressed in PC and contributes poor diagnosis in PC patients. (A) The expression level of OGT in different kinds of cancers and normal tissues from TCGA patient samples. (B) The expression level of OGT in primary prostate cancer tissues (n=497) and normal tissues(n=52) from TCGA patient samples. (C) OGT expression based on Gleason score from TCGA samples. (D) Kaplan–Meier analysis of the overall survival of patients with prostate cancer. The cut off value is 0.3. (E) The disease-free survival analysis of prostate cancer patients with high or low OGT expression from TCGA. The cut off value is 0.3. (F) Protein levels of OGT, OGA and total cellular O-GlcNAc in AR-positive (LNCaP, 22RV1) and AR-negative (PC3, DU145) PC cell lines and normal prostatic matrix immortalized cell (wpmy-1). *p < 0.05; **p < 0.01; ***p < 0.001 (Student’s t-test).

