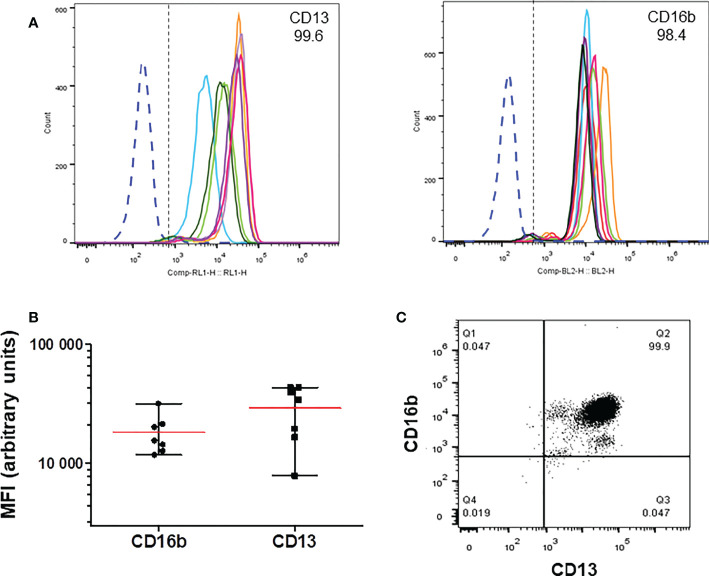
Figure 1.
Expression of CD13 in human neutrophils. Human neutrophils were stained with anti-CD13-APC and anti-CD16b-PE, and analyzed by flow cytometry. (A) Representative histograms showing the expression of CD13 (left) and CD16b (right panel) in cells from individual donors. (B) Mean (± SEM) of the Mean Fluorescence Iintensity (MFI) values of the expression of CD13 and CD16b from the histograms shown in A (C) Representative dot plot of CD13 and CD16b expression in neutrophils from a single donor. More than 99.5 percent of cells express both markers.

