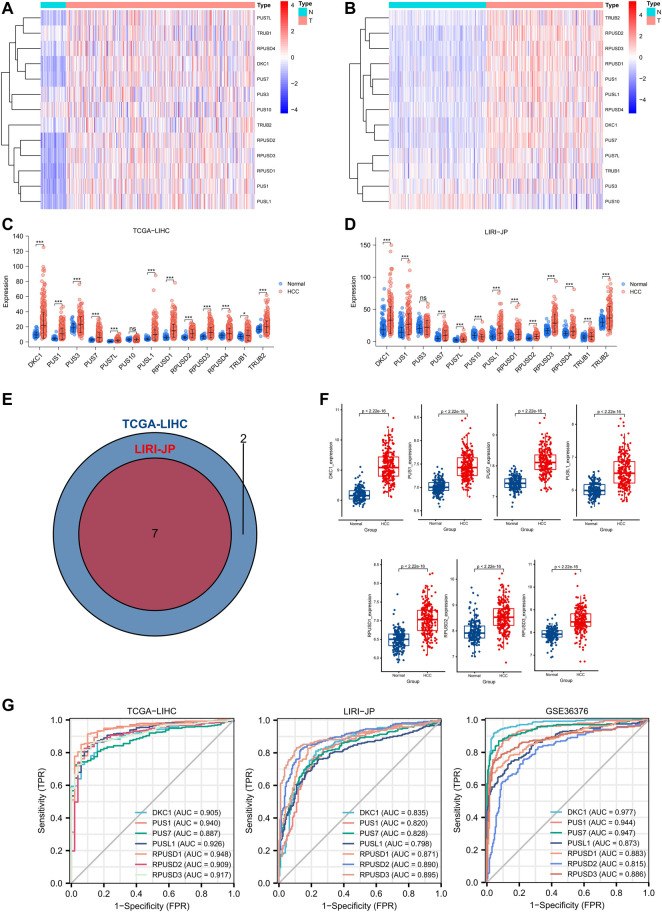
FIGURE 2.
Expression profile and diagnostic value of PUSs mRNA in HCC. (A–B) Heatmap of PUSs expression in TCGA-LIHC (A) and LIRI-JP (B); (C–D) Expression difference of PUSs between non-cancerous tissues and HCC in TCGA-LIHC (C) and LIRI-JP (D); (E) Venn diagram of differentially expressed PUSs in TCGA-LIHC and LIRI-JP; (F) Expression of seven differentially expressed PUSs between non-cancerous tissues and HCC in GSE36376; (G) ROC curves of PUSs expression in three HCC cohorts. (ns: no statistical significance, *p < 0.05, **p < 0.01, and ***p < 0.001).

