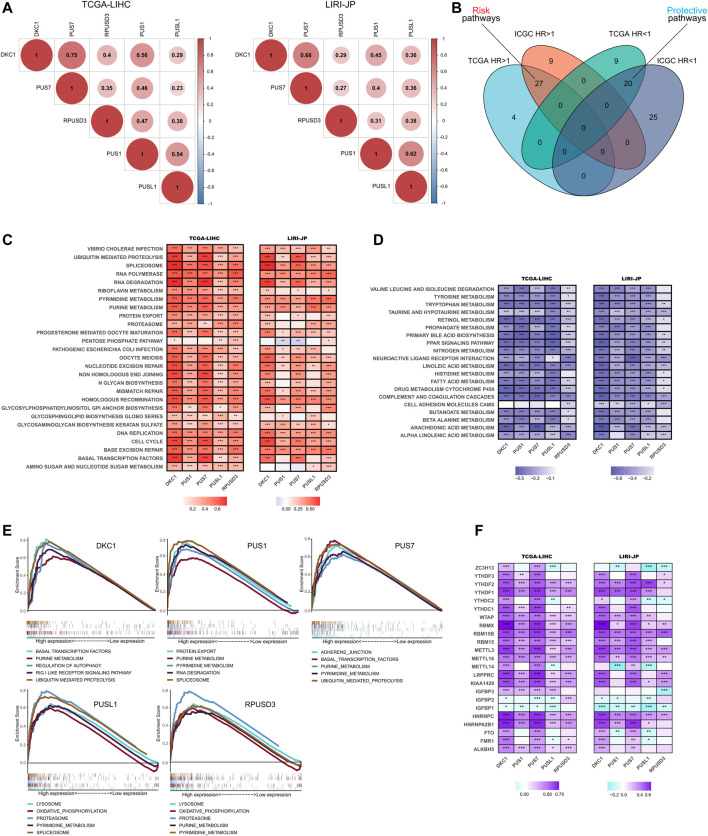
FIGURE 6.
Functional analysis of PUSs in HCC. (A) Correlation of five prognosis-related PUSs expression; (B) Venn diagram of prognosis-related pathways (GSVA scores) in TCGA-LIHC and LIRI-JP; (C–D) Correlation of PUSs expression with GSVA scores of risk pathways (C) and protective pathways (D); (E) Top five KEGG pathways in high PUSs expression group based on GSEA; (F) Correlation of PUSs expression with m6A regulators expression. (*p < 0.05, **p < 0.01, and ***p < 0.001).

