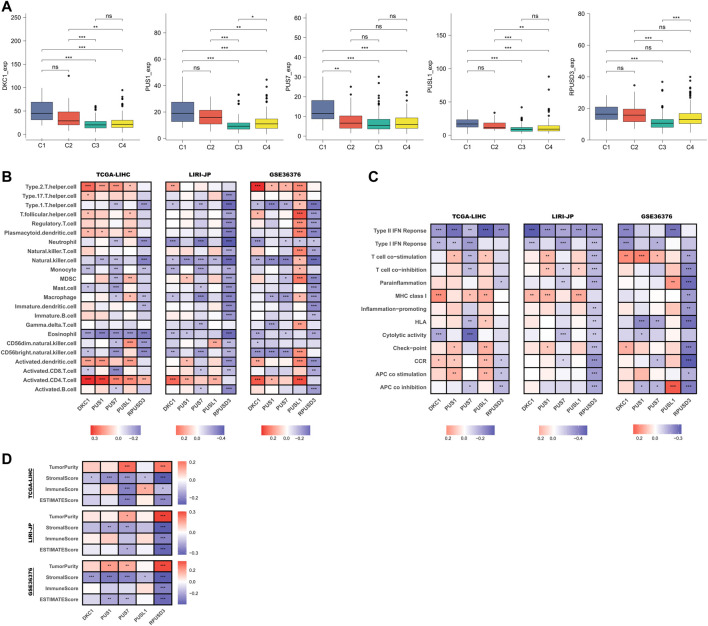
FIGURE 7.
Relationship between PUSs and TME. (A) Differences in PUSs expression in HCC tissues of different immune subtypes; (B) Correlation of PUSs expression with the estimated abundance of immune cells; (C) Correlation of PUSs expression with the estimated activity of immune functions; (D) Correlation of PUSs expression with ESTIMATE score and estimated tumor purity. (ns: no statistical significance, *p < 0.05, **p < 0.01, and ***p < 0.001).

