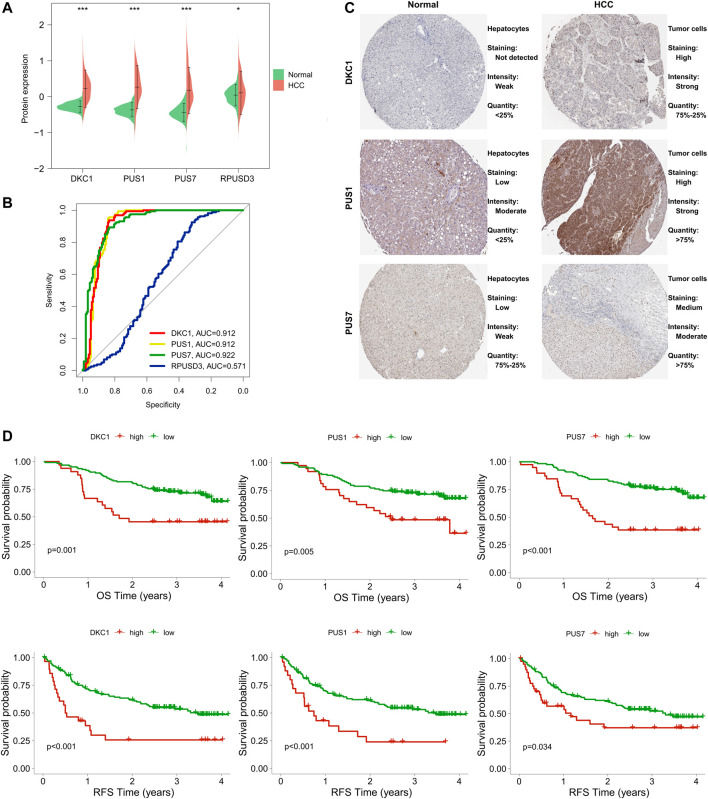
FIGURE 8.
Expression levels of PUS proteins in HCC and their diagnostic and prognostic value. (A) Differences in PUS proteins expression between non-cancerous tissues and HCC; (B) ROC curves of PUS proteins expression in HCC; (C) Representative immunohistochemical results of three differentially expressed PUS proteins; (D) K-M analysis for OS and RFS of HCC patients stratified by protein expression of three differentially expressed PUSs. (*p < 0.05, **p < 0.01, and ***p < 0.001).

