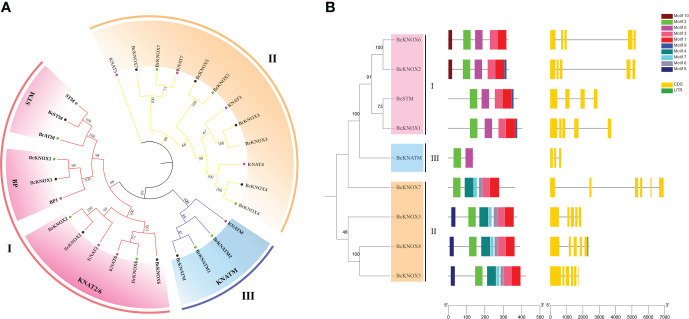
Figure 1.
Phylogenetic analysis, Schematic representation of protein and gene structure. (A) Phylogenetic analysis of the KNOX families in A thaliana, B rapa, and B campestris. The tree was clustered into three subfamilies. (B) Schematic representation of protein and gene structure of Brassica campestris KNOX gene.

