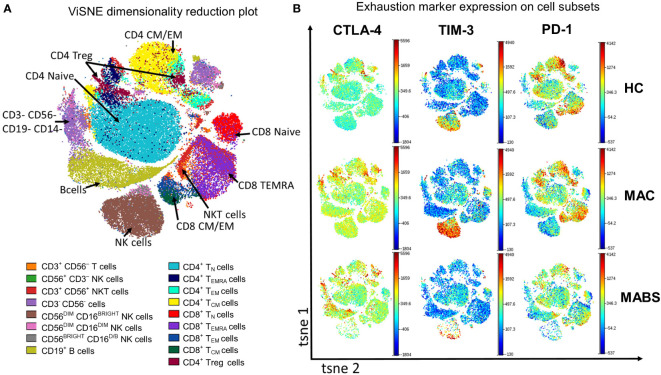
Figure 2.
Peripheral blood phenotyping analysis shows increased TIM-3 and CTLA-4 in patients with active MAC and MABS infection. (A) viSNE was used to separate immune subsets based on phenotype. TN – naïve T cells TCM – central memory T cells, TEM – effector memory T cells, TEMRA – effector memory T cells with RA phenotype. (B) Representative ViSNE plots from HC, active MAC patient, and active MABS patient are shown. ViSNE plots are coloured by the level of expression of CTLA-4, TIM-3, and PD-1.

