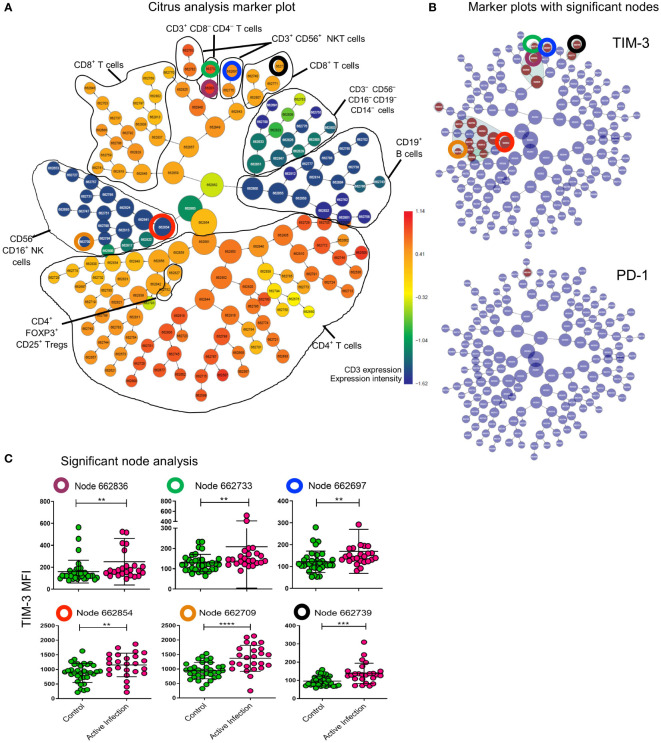
Figure 3.
CITRUS analysis defines effrctor cell nodes that upregulate TIM-3 during active infection. All cells of lymphocyte gate in patients with Active infection (active MAC and active MABS) and controls (BronchC and HC) were analysed with CITRUS (Becman Coulter). (A) Marker plot showing all cells (central node) sequentially divided into daughter nodes based on dissimilarity of expression of lineage markers specified in the analysis setup (coloured by CD3 expression as heatmap). Black lines – cell subsets identified based on other marker plots not shown here. The total lymphocyte gate is represented in this plot. (B) The same marker plot as shown in (A) are coloured by cell nodes (brown) that have significantly different expression of TIM-3 and PD-1 to controls. CTLA-4 was not differentially expressed in this analysis. Nodes that were analysed further are highlighted with coloured circles. Corresponding circles in the marker plot show the lineage of the node (A). (C) Nodes identified for further analysis are identified by the coloured circle and by node number. MFI of TIM-3 for the cells assigned to the given node for each sample is shown. Comparison between cohorts was performed by Mann-Whitney test. Maroon circle CD3+CD4-CD8- T cell parent node (p=0.0039); Green circle subset of CD3+CD4-CD8- T cells (p=0.0071); blue circle CD3+CD56+NKT cells (p=0.0014); red circle CD3-CD56+CD16+ NK cell parent node (p=0.0041); orange circle CD3-CD56+CD16+ NK cell daughter node (p<0.0001); black circle CD3+CD8+ T cells (p=0.0005). ****p < 0.0001, ***p < 0.001, **p < 0.01.

