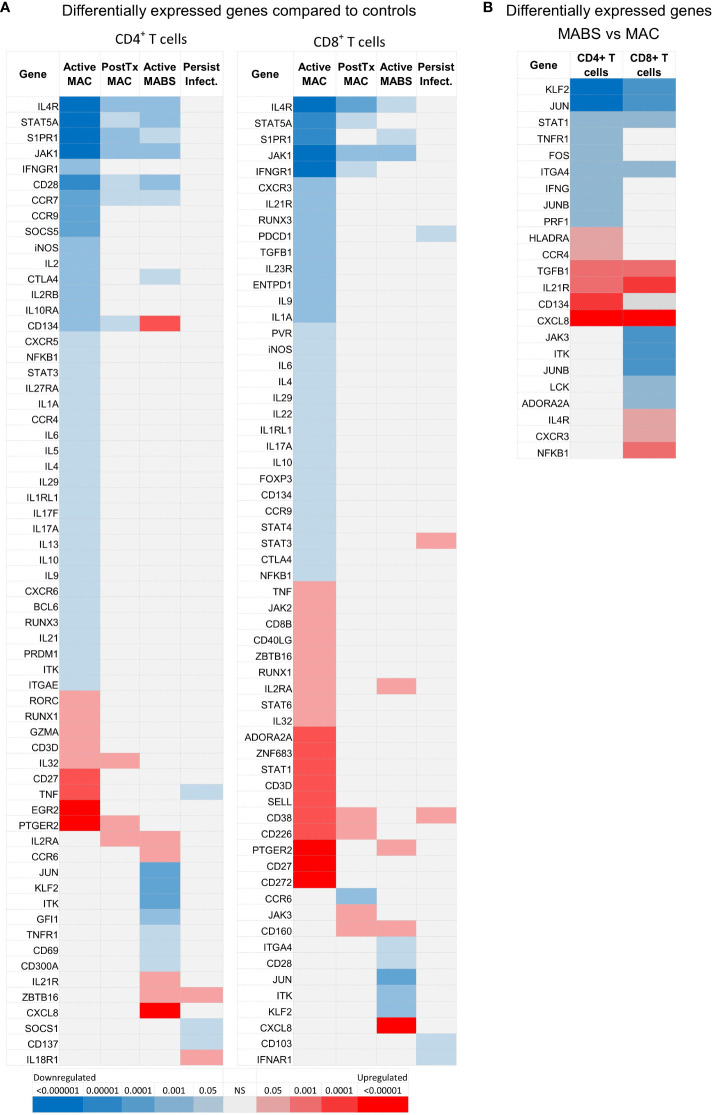
Figure 4.
NanoString-based gene expression levels in CD4+ and CD8+ T cells in NTM-PD. (A) Statistical heatmap of upregulated (red) and downregulated (blue) genes in patients with active MAC, PostTx MAC, active MABS or persistent infection (MAC or MABS) compared to the control group (BronchC and HC). (B) Statistical heatmap of upregulated and downregulated genes in patients with active MABS infection compared to patients with active MAC infection. Independent t-tests were performed using GMine with correction for multiple comparisons (FDR). Significance (p-value) is shown by colour intensity.

