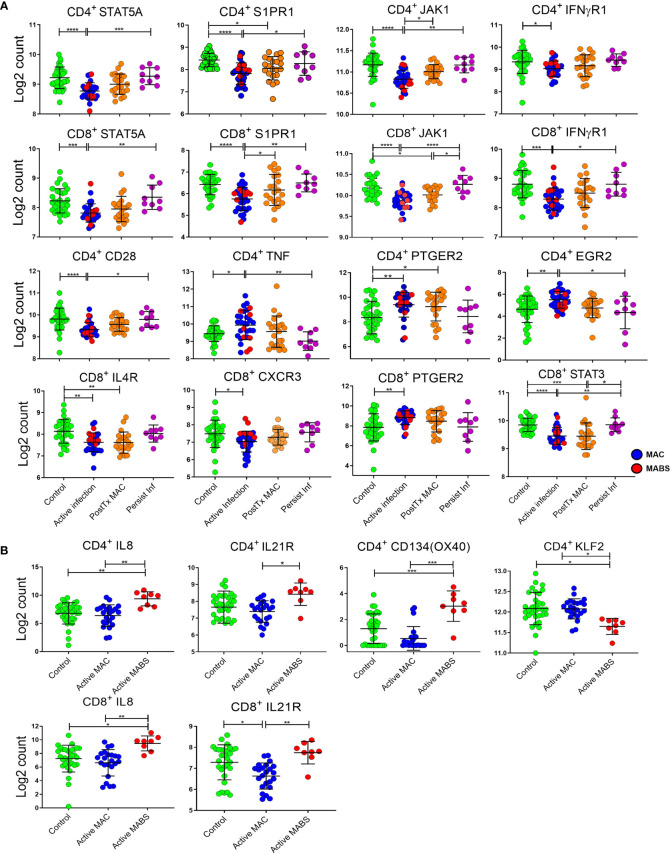
Figure 5.
Relative expression of individual immune genes in CD4+ and CD8+ T cells. (A) Expression, as log2 counts, of immune genes that differentiate active infection [MAC (blue) and MABS (red)] from Controls [BronchC and HC (green)]. Levels of PostTx MAC (orange) and Persistent Infection (purple) and significance of comparisons are shown. (B) Expression of immune genes differentiating infecting species (MAC versu MABS) in active infection are shown as log2 counts of RNA copy numbers. Mean, and SD are shown in black bars. Comparisons between cohorts were performed by ANOVA with Tukeys post hoc test. P values were adjusted for multiple comparisons ****p < 0.0001, ***p < 0.001, **p < 0.01, *p < 0.05.

