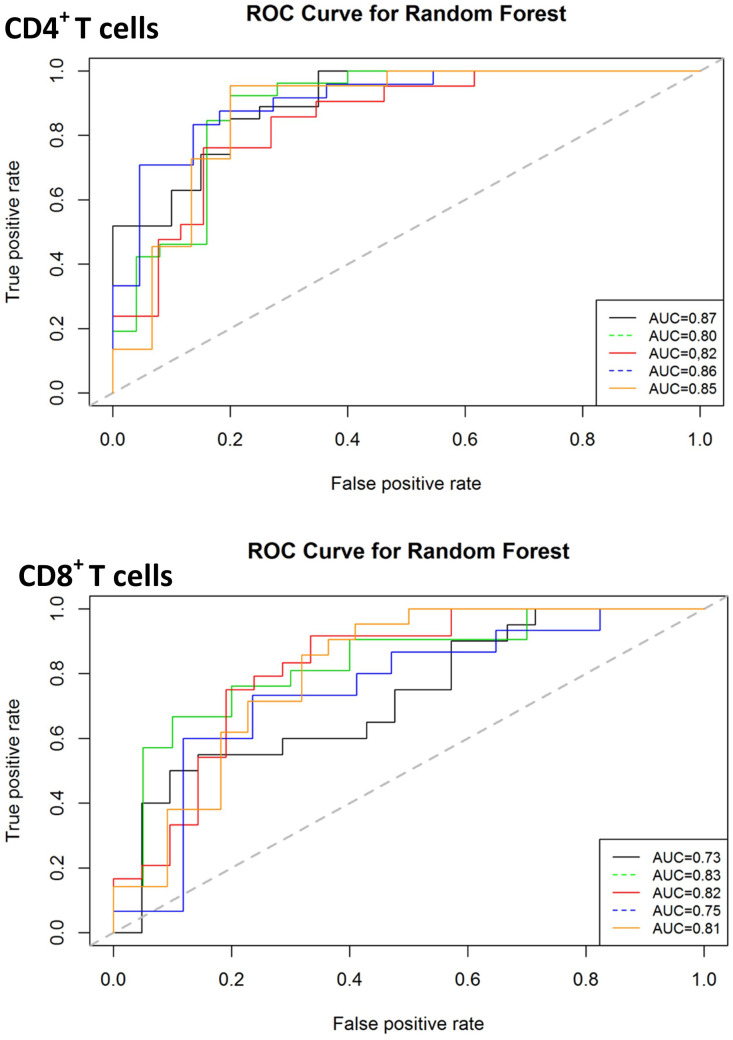
Figure 6.
Classification performance of predictive models on validation data sets for diagnosis of active infection. The ROC curves for predictive model accuracy. Random forest models developed on 70% of test data sets were validated on 30% validation datasets. The process was repeated five times. AUC – Area under the curve.

