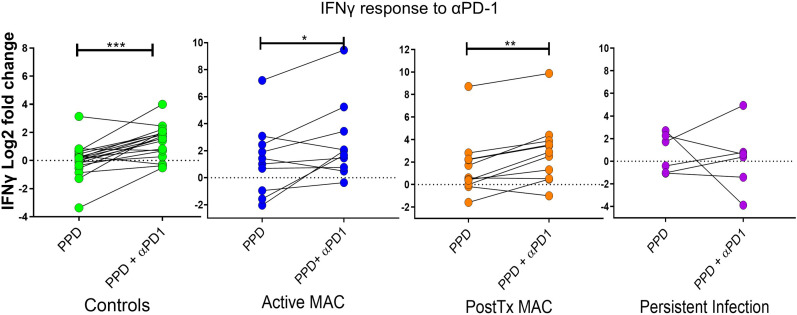
Figure 8.
IFN-γ response to treatment with nivolumab (αPD-1). Dot plots show IFN-γ response (measured by cytometric bead array) to PPD in patients and controls with and without αPD-1 treatment. IFN-γ levels are shown as log2 fold change over level of unstimulated wells. A Wilcoxon test was performed. ***p < 0.001, **p < 0.01, *p < 0.05.

