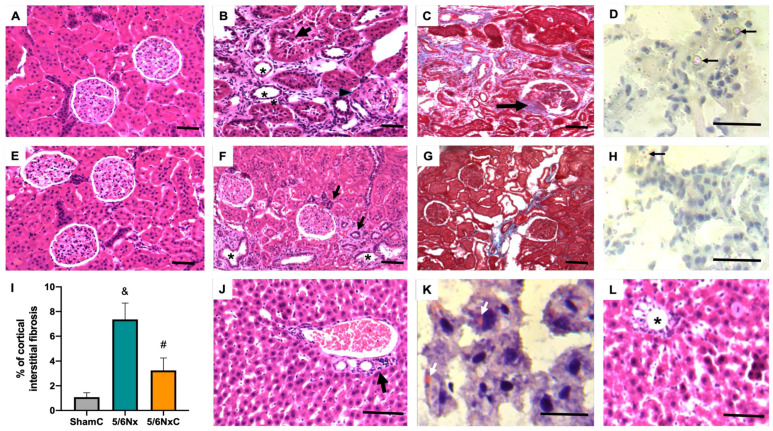
Figure 3.
Representative micrographs from the four experimental groups: Sham, Sham + curcumin (ShamC), five-sixths nephrectomy (5/6Nx), and 5/6Nx + curcumin (5/6NxC). (A) Histologically normal kidney from Sham group rat. (B) In comparison, the 5/6Nx rat kidney shows interstitial fibrosis with chronic inflammatory infiltrate, tubules with atrophic (asterisks) or necrotic (arrow) epithelium, glomerulus with retracted capillaries, and vascular pole fibrosis (arrowhead). (C) Masson’s trichrome stain in 5/6Nx rat kidney shows more evident fibrosis, collagen stained blue, particularly in the interstitium and in the vascular pole of some glomeruli (arrow). (D) Oil red staining of the 5/6Nx group shows numerous cytoplasmic small red vacuoles in tubular cells that correspond to lipids; some tubules have big lipid drops in the tubular lumen (arrows). (E) Kidney section of a ShamC does not show histological alterations. (F) Treatment with curcumin in animals with 5/6Nx (5/6NxC group) induces a decrease in renal fibrosis and preservation of cortical tubules, some tubules show necrotic epithelium (asterisks), and others are small and lined with cubic cells with hyperchromatic nuclei corresponding to cells in regeneration (arrows), the glomeruli do not show fibrosis or retraction of the capillaries. (G) Masson’s staining shows decreased interstitial fibrosis and glomerular affectation in the 5/6NxC rat kidney. (H) Oil red staining in 5/6NxC rat kidney shows some epithelial cells with occasional cytoplasmic lipid vacuoles (arrow). (I) The automated morphometric analysis showed a significant decrease in interstitial fibrosis in the 5/6NxC group compared to the 5/6Nx group. (J) Portal area of the 5/6Nx liver showing chronic inflammatory infiltrate (arrow). (K) Oil red staining shows some 5/6Nx hepatocytes with scare cytoplasmic lipid vacuoles (white arrows). (L) The portal areas (asterisk) of the 5/6NxC rat liver without inflammation, some hepatocytes show regenerative changes such as increased cell and nuclear size, hyperchromasia and binucleation. Kidney sections staining H/E and Masson 200× magnification, liver micrographs H/E staining 400× magnification, frozen sections red oil staining 1000× magnification. Bars represent 100 μ in paraffin sections and 50 µ in frozen sections.

