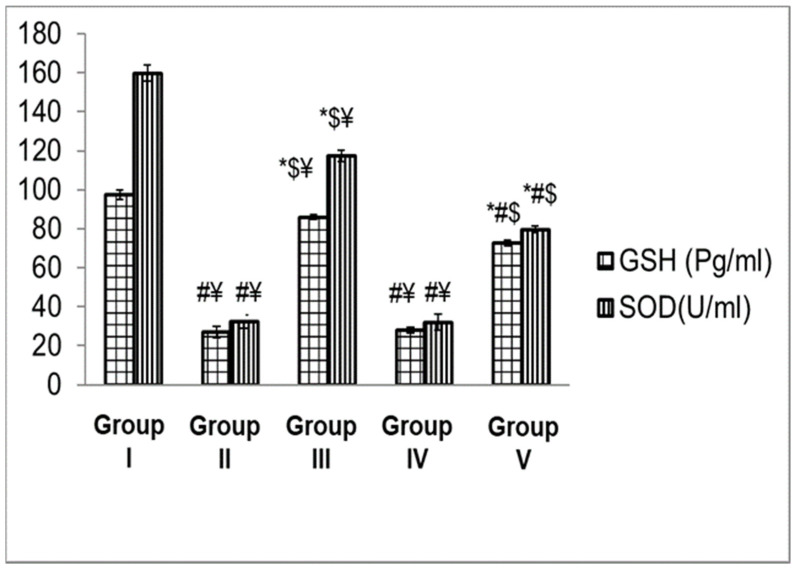
Figure 11.
Levels of oxidative stress markers (GSH and SOD) determined for Group I (negative control, shaved animal skin was not swapped with S. aureus, and no samples were swapped afterwards), Group II (positive control, animal skin was swapped only with S. aureus, and remained untreated), Group III (shaved animal skin was swapped with S. aureus followed by swapping with ZnO-NPs group), Group IV (shaved skin was swapped with S. aureus and then swapped with 3% PVP), and Group V, (shaved animal skin was swapped with bacteria and then after swapped with Sterillium). Data are expressed as average of results, which are the average of five independent readings. Error bars represent standard error. Data were analyzed by one-way ANOVA. *, #, $, and ¥ represent significant differences at p < 0.05, where * represents significant differences when compared to positive control group, # represents significant differences when compared to ZnO-NPs group, $ represents significant differences when compared to 3% PVP group, ¥ represents significant differences when compared to Sterillium.

