Figure 2.
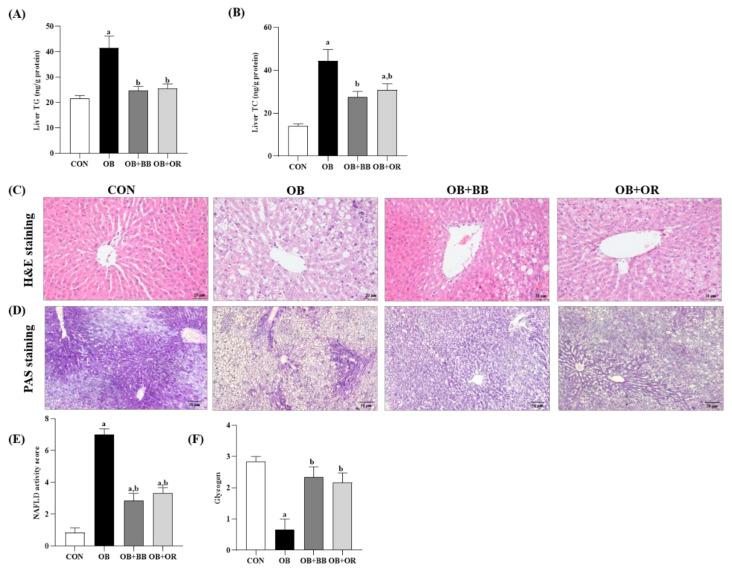
Effect of bee bread on liver lipid levels and hepatic steatosis. (A) Liver TG level, (B) liver TC level, (C) H&E staining (magnification ×400, scale bars represent 20 μm) and (D) PAS staining (magnification ×100, scale bars represent 50 μm) analyses of liver, (E) NASH scoring, and (F) glycogen scoring of rats in all experimental groups. Values are presented as mean ± SEM, n = 8/group. CON, control; OB, obese; OB + BB, obese + bee bread 0.5 g/kg body weight/day; OB + OR, obese + orlistat 10 mg/kg body weight/day; TG, triglyceride; TC, total cholesterol. One-way ANOVA, followed by Tukey post-hoc test. a p < 0.05 vs. CON group, b p < 0.05 vs. OB group.

