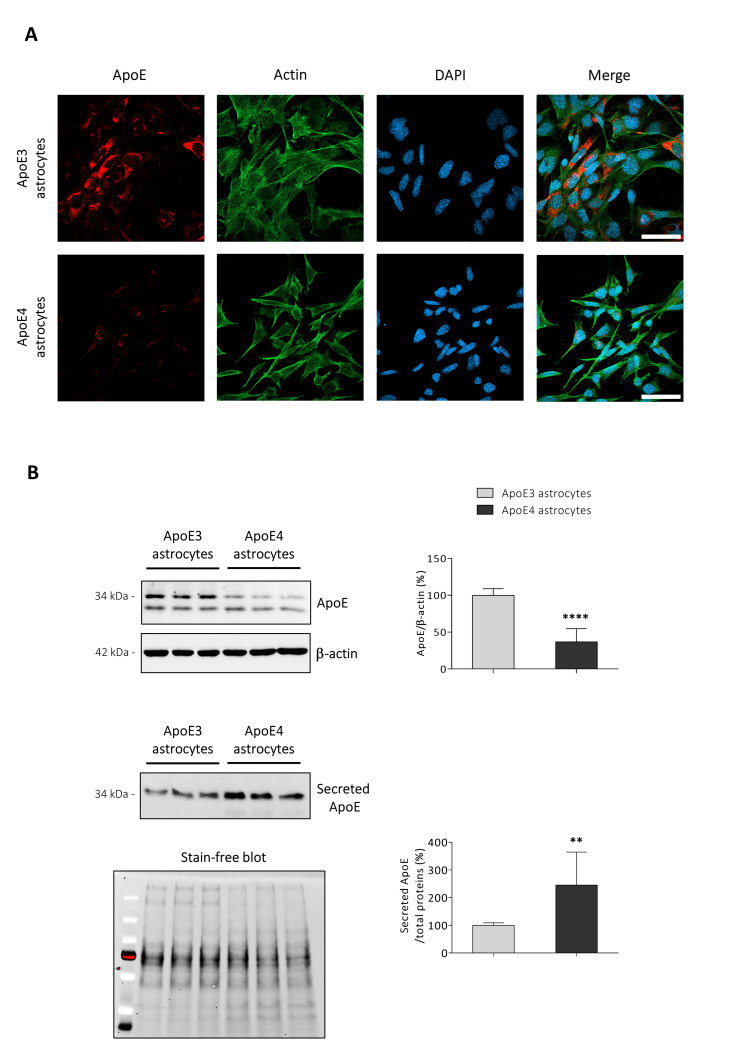
Figure 1.
ApoE synthesis and release is altered in ApoE4 astrocytes. (A) ApoE protein levels were examined by immunocytochemistry. Antibodies detecting ApoE (red), and β-actin (green), were used and nuclei were stained with DAPI (blue). Representative images are shown. Cells were imaged by using an LSM800 confocal microscope (Zeiss, 63X oil objective; scale bar: 50 μm). (B) ApoE protein levels were analysed by Western blotting in both cell lysates and concentrated media from ApoE3 and ApoE4 immortalized mouse astrocytes. Concerning cell lysates, ApoE levels were normalized to the corresponding β-actin levels and data are represented as percentages of average ApoE3 values. Data are expressed as mean values ± SD of four different experiments (n = 14, Student’s t-test). Concerning concentrated media, ApoE levels were normalized to total proteins loaded into the corresponding well (Stain-free method) and data are represented as percentage of average ApoE3 values. Data are expressed as mean values ± SD of four different experiments (n = 11, Student’s t-test). **** p < 0.0001, ** p < 0.01 vs. ApoE3 astrocytes.

