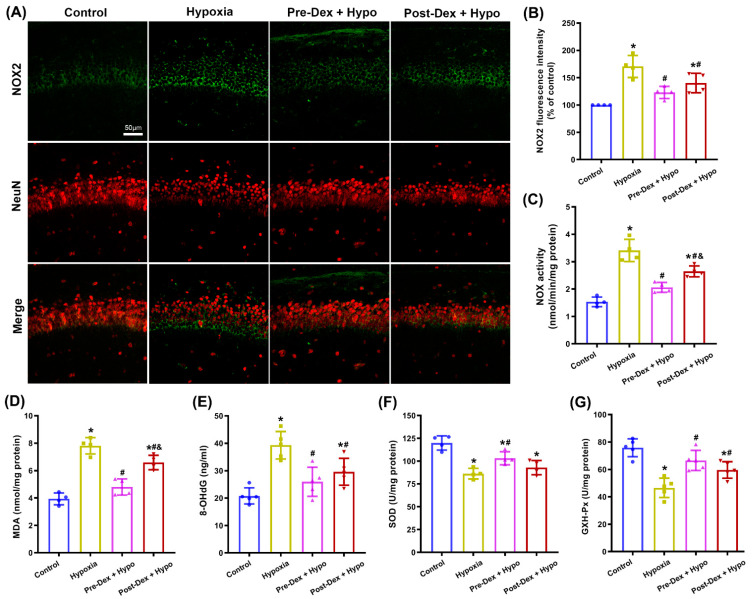
Figure 2.
The effect of Dex on NOX2 activity and oxidative stress in the hippocampus following neonatal hypoxia. (A) Representative immunofluorescence images of NOX2 (green) and NeuN (red) in the hippocampal CA1 region. (B) The intensity of NOX2 fluorescence was quantified using ImageJ software. (C) A cytochrome c reduction assay was used to measure NOX activity. (D) MDA levels were assessed using the TBA colorimetric method. (E) DNA 8-OHdG levels were determined using an 8-OHdG ELISA kit. (F) SOD activity was assessed using the WST-1 method. (G) GSH-Px activity was assessed using the UV colorimetric assay. Results are expressed as mean ± SD (n = 4–5 in each group). Each animal data point in the bar graph is also presented. * p < 0.05 versus the Control group; # p < 0.05 versus the Hypoxia group; & p < 0.05 versus the Pre-Dex group. Hypo, hypoxia; Pre-Dex, pretreatment with dexmedetomidine; Post-Dex, post-treatment with dexmedetomidine.

