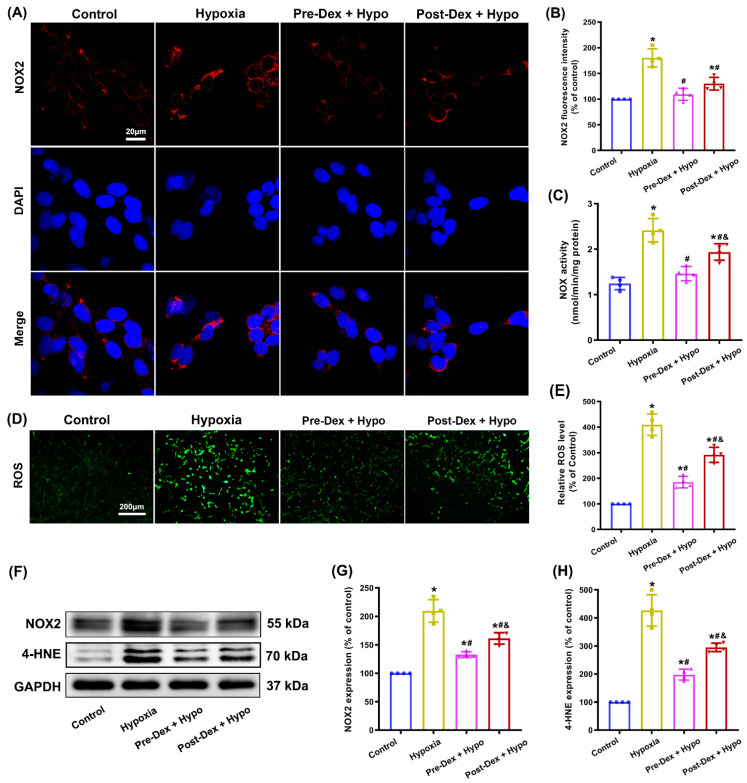
Figure 3.
The effect of Dex on NOX2 activity and oxidative stress in cultured hippocampal neurons following hypoxia. (A) Representative confocal images stained for NOX2 (red) and DAPI (blue) in cultured hippocampal neurons. (B) The intensity of NOX2 fluorescence was quantified using ImageJ. (C) Cytochrome c reduction assays were used to measure NOX activity. (D) Intracellular ROS production was detected using the DCFH-DA probe. (E) The intensity of ROS fluorescence was analyzed using ImageJ. (F) NOX2 and 4-HNE protein levels were detected by Western blotting, and the relative expression levels of NOX2 (G) and 4-HNE (H) were analyzed using ImageJ. Results are expressed as mean ± SD (n = 4 in each group). Each data point in the bar graph is also presented. * p < 0.05 versus the Control group; # p < 0.05 versus the Hypoxia group; & p < 0.05 versus the Pre-Dex group.

