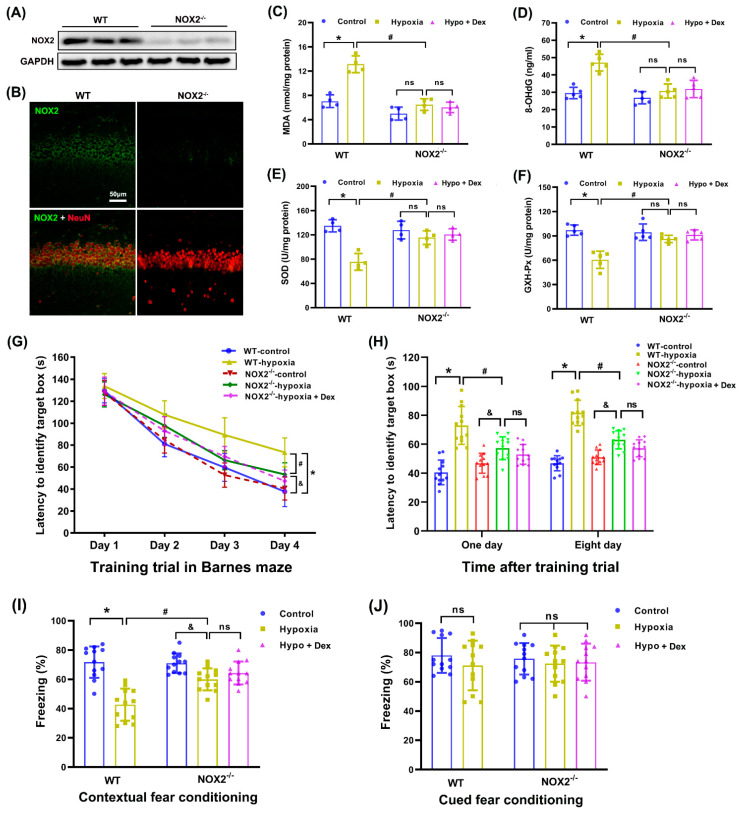
Figure 7.
Modulation of Dex-induced neuroprotection in neonatal mice by NOX2 depletion. (A,B) Representative images of the genetic identification of NOX2−/− neonatal mice via Western blotting and immunofluorescence assays in the hippocampus. (C) MDA levels were assessed using the TBA colorimetric method. (D) DNA 8-OHdG levels were assessed using an 8-OHdG ELISA kit. (E) SOD activity was assessed using the WST-1 method. (F) GSH-Px activity was assessed using the UV colorimetric assay. (G) Performance with the Barnes maze test in the training sessions. (H) Performance with the Barnes maze test in the memory phase. (I) Contextual fear conditioning test. (J) Cued fear conditioning test. Results are expressed as mean ± SD (n = 4 in each group for panel A and B; n = 4–5 in each group for panel C to F; n = 12 in each group for Barnes maze and fear conditioning test data). Each animal data point in the bar graph is also presented. * p < 0.05, # p < 0.05, & p < 0.05 for the comparison. ns, not significant.

