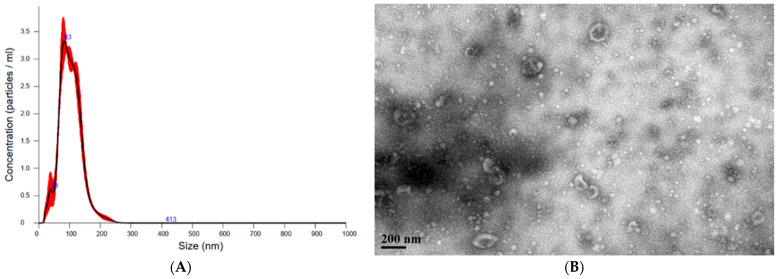
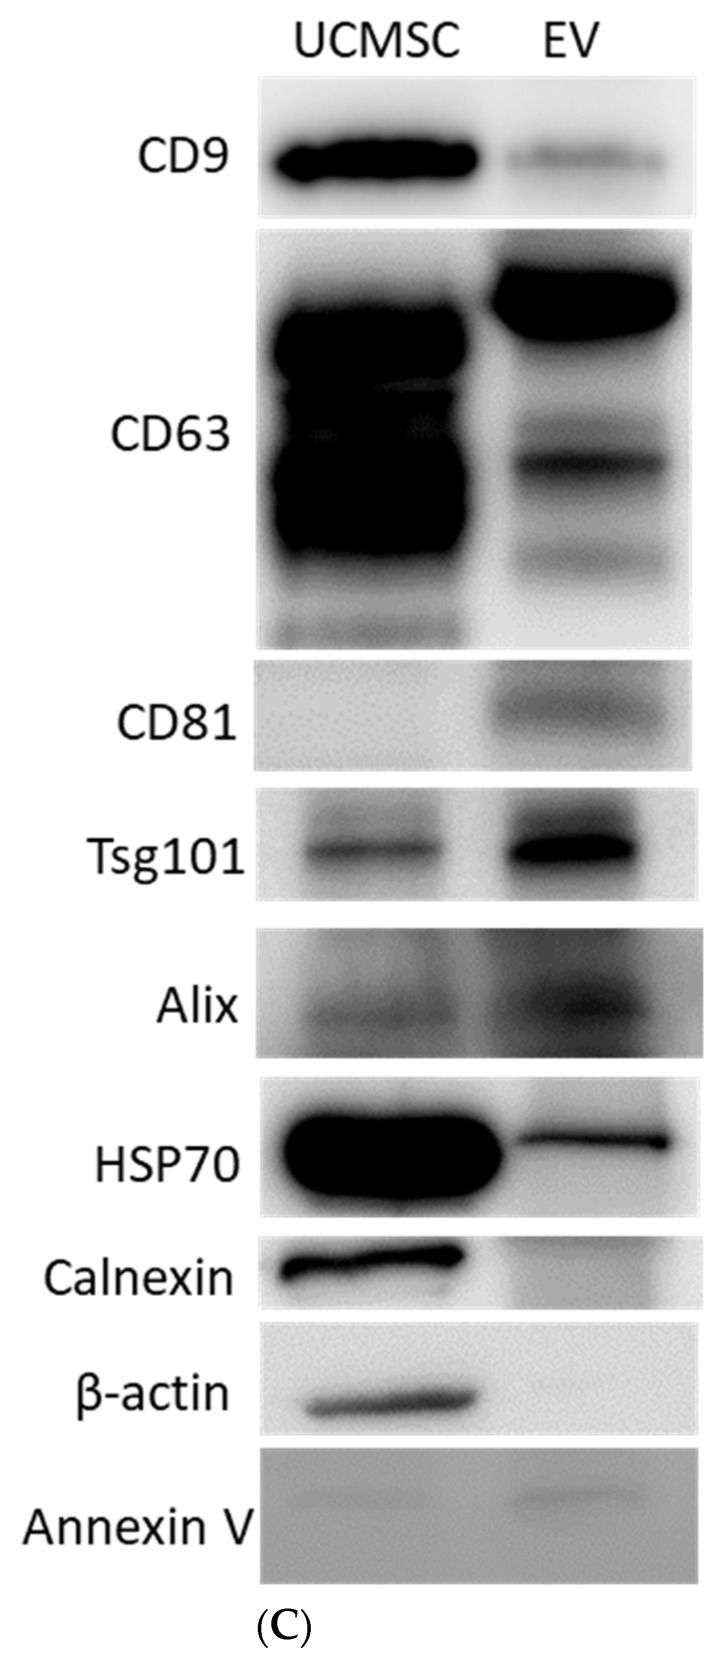
Figure 1.
Characteristics of UCMSC-EVs. (A) Size distributions of UCMSC-EVs based on NTA measurements. The mean diameters were 103.3 ± 1.0 nm. (B) EVs were negatively stained and viewed by transmission electron microscopy at a magnification of 60,000. The scale bar represents 200 nm. (C) Representative immunoblot showing the expression of the EVs’ markers CD9, CD63, CD81, Tsg101 and Alix, whereas HSP70, calnexin, annexin V and β-actin acted as negative control.


