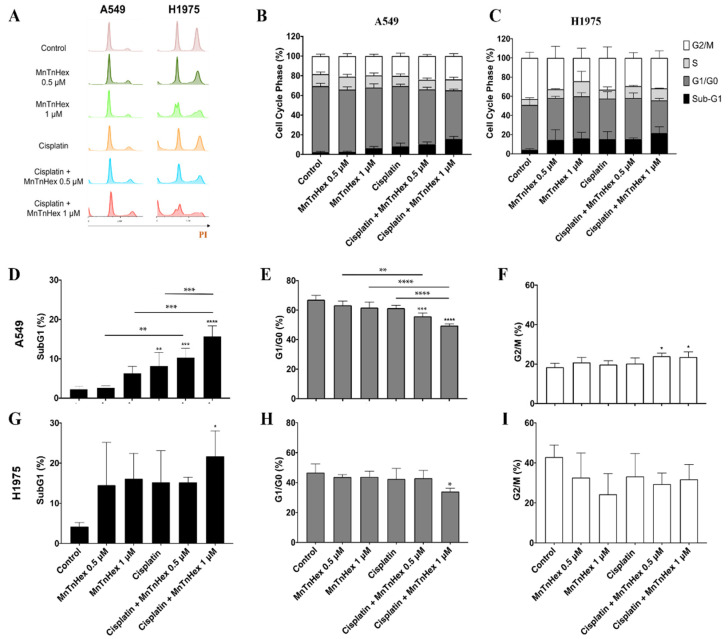
Figure 5.
Effect of MnTnHex combined with cisplatin in A549 and H1975 cells on cell cycle distribution. Cells were treated with the indicated concentrations of MnTnHex and cisplatin (1 µM) for 72 h and DNA content was assessed on fixed cells by flow cytometry. (A) Representative flow cytometry histograms of PI-stained cells. Summary data of cell cycle populations for (B) A549 and (C) H1975 cells. Individual populations for (D–F) A549 and (G–I) H1975 cells. Values represent mean ± SD (n = 3–4) and are expressed as percentages of total cells. * p < 0.05, ** p < 0.01, *** p < 0.001 and **** p < 0.0001 (one-way ANOVA with Tukey’s multiple comparisons test) when compared with control cells, or between any two conditions as indicated in the figure by connecting lines.

