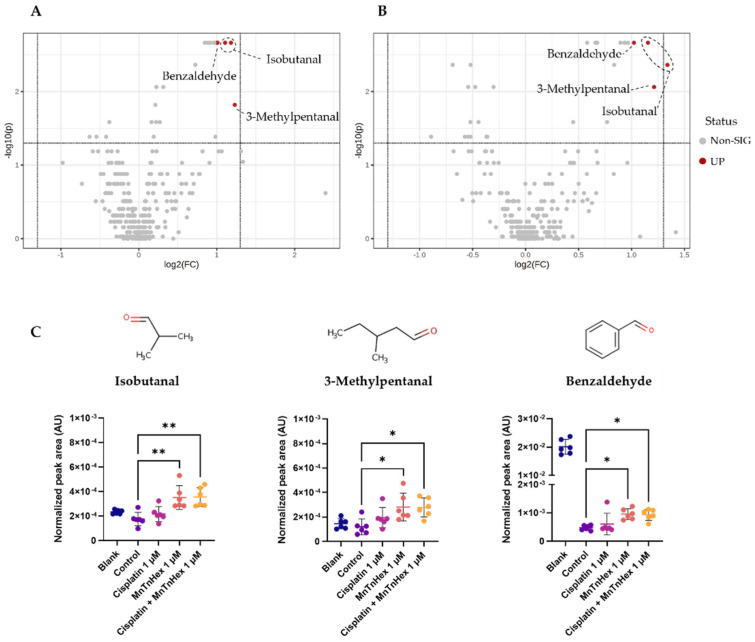
Figure 7.
GC-MS-based metabolomics analysis of the extracellular media of H1975 cells exposed to MnTnHex and cisplatin, alone and combined. (A) Volcano plot of the GC-MS data of H1975 cells exposed to MnTnHex (1 μM) 72 h compared with controls. (B) Volcano plot of GC-MS data of H1975 cells co-exposed to Cisplatin (1 μM) and MnTnHex (1 μM) compared with controls, indicating the statistical significance (p-value) vs. the magnitude of change (fold change). Statistical significance was assessed using the Mann-Whitney test and p-values < 0.05 were considered significant. The grey dots indicate non-significant m/z-RT pairs, while the red dots indicate statistically significant m/z-RT pairs corresponding to isobutanal, 3-methylpentanal and benzaldehyde as marked. (C) Boxplots representing the normalized peak areas of the three significant VCCs. Statistical significance was assessed using the Kruskal-Wallis ANOVA test (* p < 0.05, ** p < 0.01).

