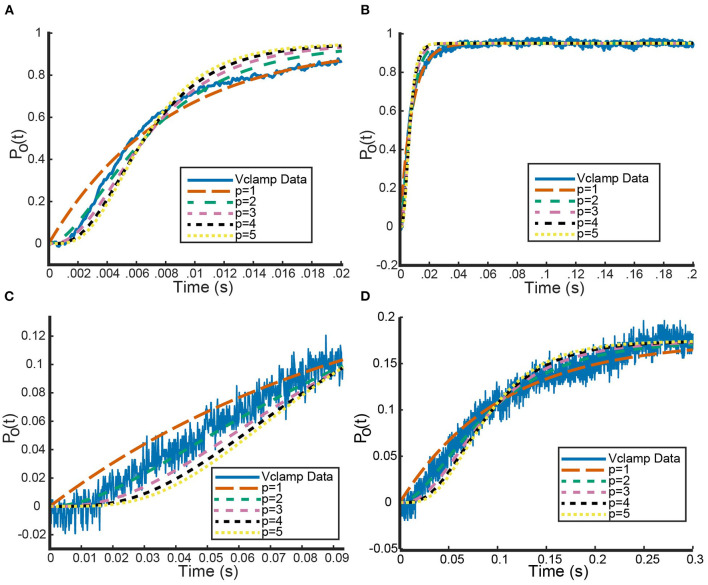
Figure 1.
Sample fits of five curves of the form seen in Equation (14) to voltage clamp data (shown in blue) from Channelpedia (Ranjan et al., 2011, 2019). Each curve corresponds to a different value of p, the number of gates being used to fit the data. (A,C) A zoomed in version to make clear the performance of each model on capturing the sigmoid shape of the beginning portion of the data. (B,D) The whole timescale with each of the five fits. Curve colors are as follows: p = 1 (orange), p = 2 (green), p = 3 (pink), p = 4 (black), p = 5 (yellow). Curve dash sizing and spacing is given in figure legend. (A,B) correspond to a voltage step from −90 up to 20 mV while panels (C,D) correspond to a voltage step from −90 up to −30 mV.

