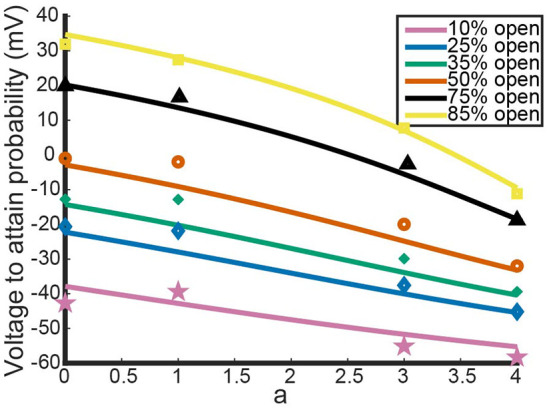
Figure 3.

Model outputs showing the voltage at which a particular probability of opening is achieved. The x-axis denotes the proportion of subunits/gates that are KV1.1 vs. KV1.2 with a = 4 corresponding to a KV1.1 homomer with four subunits/gates. Each curve color corresponds to a different probability of opening from the model output. The data points are the Al-Sabi data points of each channel type for any given probability of opening and are colored accordingly. Although the non-integer values of a are irrelevant under the model framework, the curves are left for clarity of the trends moving from a = 4 to a = 0.
