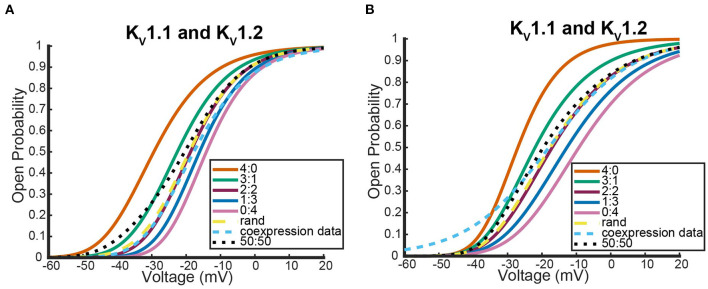
Figure 6.
Steady state probability curves as a function of voltage for cells containing various channel types in two different experiments. The coexpression data and homomeric data for model fitting was taken from D'Adamo et al. (1999) (A) and Imbrici et al. (2008) (B). The steady state probability curves presented here are for homomeric Kv1.1 (4:0) and Kv1.2 (0:4) channels, heteromeric Kv1.1/1.2 channels (3:1, 2:2, 1:3), the model output of a random assembly of Kv1.1 and Kv1.2 subunits expressed in 50:50 ratio (rand), the data output of a 50:50 expression of Kv1.1 and Kv1.2 cDNAs (coexpression data), and a model output of an equal split between only homomeric channels (50:50). Curve color and type are shown in the legends. Homomeric channels and their related heteromers being looked at are also detailed in figure titles.

