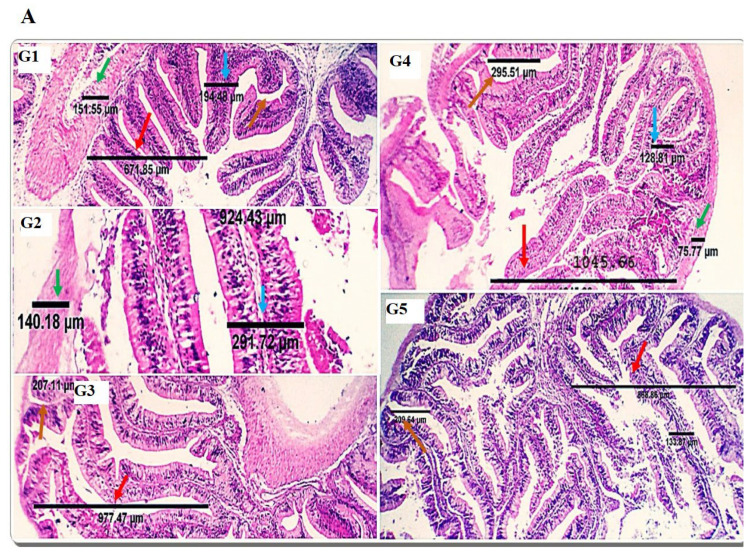
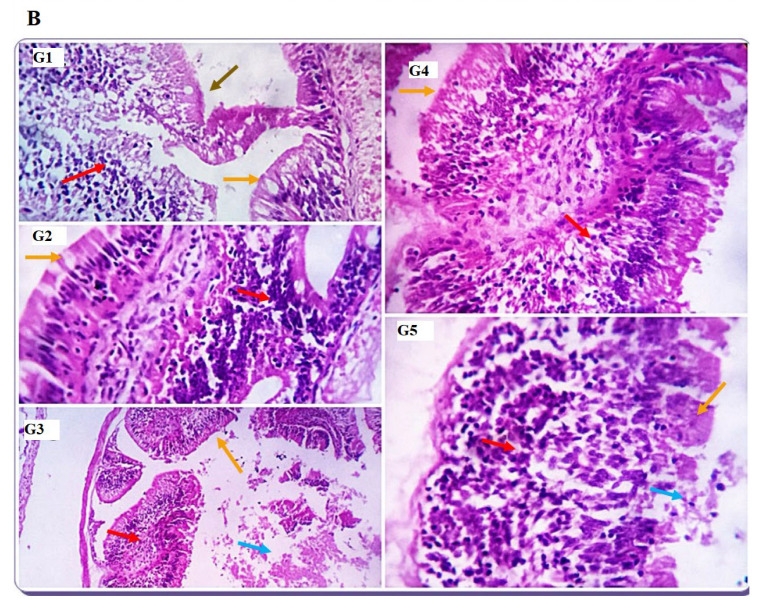
Figure 4.
Photomicrographs demonstrating the histomorphological changes in the anterior (A) and posterior (B) intestines of the control (1) and treatment groups (2–5) with variable dimensional changes regarding villous length (red arrows), villous width (blue arrows), the crypt of Lieberkühn length (orange arrows), muscular coat thickness (green arrows), and goblet cell populations (black star). Mucosal folds of the posterior intestine (brown arrows) and lymphocytic populations (red arrows) are seen. G1: SDBH0, G2: SDBH2.5, G3: SDBH5, G4: SDBH7.5, G5: SDBH10. H&E. scale bar 50 and 100 µm.


